Home / A/B Testing / How to Calculate ROI for an Enterprise A/B Testing Platform
A high win rate doesn’t guarantee a high return on your A/B testing investment. Experiments generate business value only when validated improvements are deployed, their impact translates into measurable financial gains, and those gains outweigh the full cost of running the program.
For enterprises investing in experimentation at scale, understanding ROI means looking beyond winning tests to the revenue generated, costs incurred, and opportunities lost along the way. This guide breaks down how to calculate enterprise A/B testing ROI, identify what drives or limits returns, and turn experimentation into measurable business value.
How to calculate the ROI of an enterprise A/B testing platform
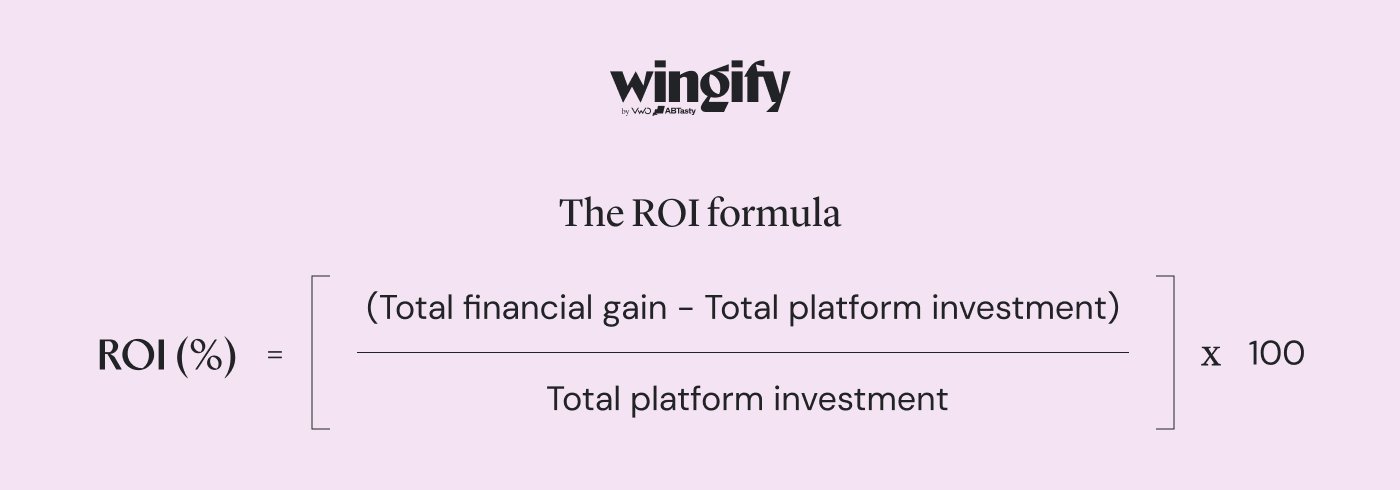
To measure ROI for an enterprise A/B testing platform, subtract the total platform investment from the financial value generated through experimentation. Divide the result by the total investment, then multiply by 100.
The ROI formula
Let’s see how to calculate the above required numbers:
Calculate the total financial gain
Start with the incremental revenue generated by successful tests over a defined period, usually one year.
The required inputs are:
Annual eligible traffic: Visitors or users who could receive the tested experience.
Baseline conversion rate: The percentage of eligible users completing the experiment’s primary goal before the improvement.
Average order value or value per conversion: The average revenue generated by each conversion.
Validated conversion lift: The relative improvement produced by experiments and subsequently deployed.
Incremental revenue = Annual eligible traffic × Baseline conversion rate × Relative conversion lift × Average order value
For greater financial accuracy, enterprises can convert incremental revenue into gross profit:
Use only the value from changes that were deployed. Adjust the estimate if a winning variation reached only part of the eligible traffic or remained live for only part of the year.
Calculate the total platform investment
Include every cost required to implement and operate the platform:
Software license: The annual enterprise subscription and usage charges.
Implementation and integration: Initial engineering or agency costs for platform setup, SDK implementation for server-side testing, tracking configuration, and connections with analytics, CRM, and other marketing tools.
Internal labor: The proportionate cost of product managers, developers, analysts, designers, and CRO specialists involved in experimentation.
Including these costs lets you compare enterprise vendors based on total economic value rather than license price alone.
A worked example
Note:The figures below are illustrative. They demonstrate the calculation and should not be treated as benchmarks for a real budget proposal.
Suppose an enterprise runs 40 experiments over a year and records a 30% win rate, resulting in 12 winning test variations that are deployed. Post-deployment measurement shows that each variation generates an average of $50,000 in incremental annual revenue, producing a total financial gain of $600,000.
The program costs $75,000 in annual platform licensing and $70,000 in technical setup, engineering, and analyst time. Its total annual investment is therefore $145,000.
ROI = [($600,000 − $145,000) ÷ $145,000] = 3.14
ROI% = 3.14 x 100 = 314%
The program generated $600,000 in financial gains on a $145,000 investment, resulting in a net benefit of $455,000 and an ROI of approximately 314%.
How enterprise A/B testing ROI scales with traffic and revenue
Traffic and revenue affect ROI through two different mechanisms. Revenue determines the financial value of a validated lift. Traffic volume determines how quickly an experiment can collect the sample needed to validate that lift.
Faster validation → More completed tests → More opportunities to ship winners
A sustained 2% improvement represents $200,000 on $10 million in eligible annual revenue and $2 million on $100 million. The percentage lift is the same, but the financial value and therefore potential ROI change with the revenue base.
Use eligible revenue rather than company-wide revenue. If an experiment affects only one product, region, device type, or funnel stage, its uplift applies only to the revenue exposed to that change.
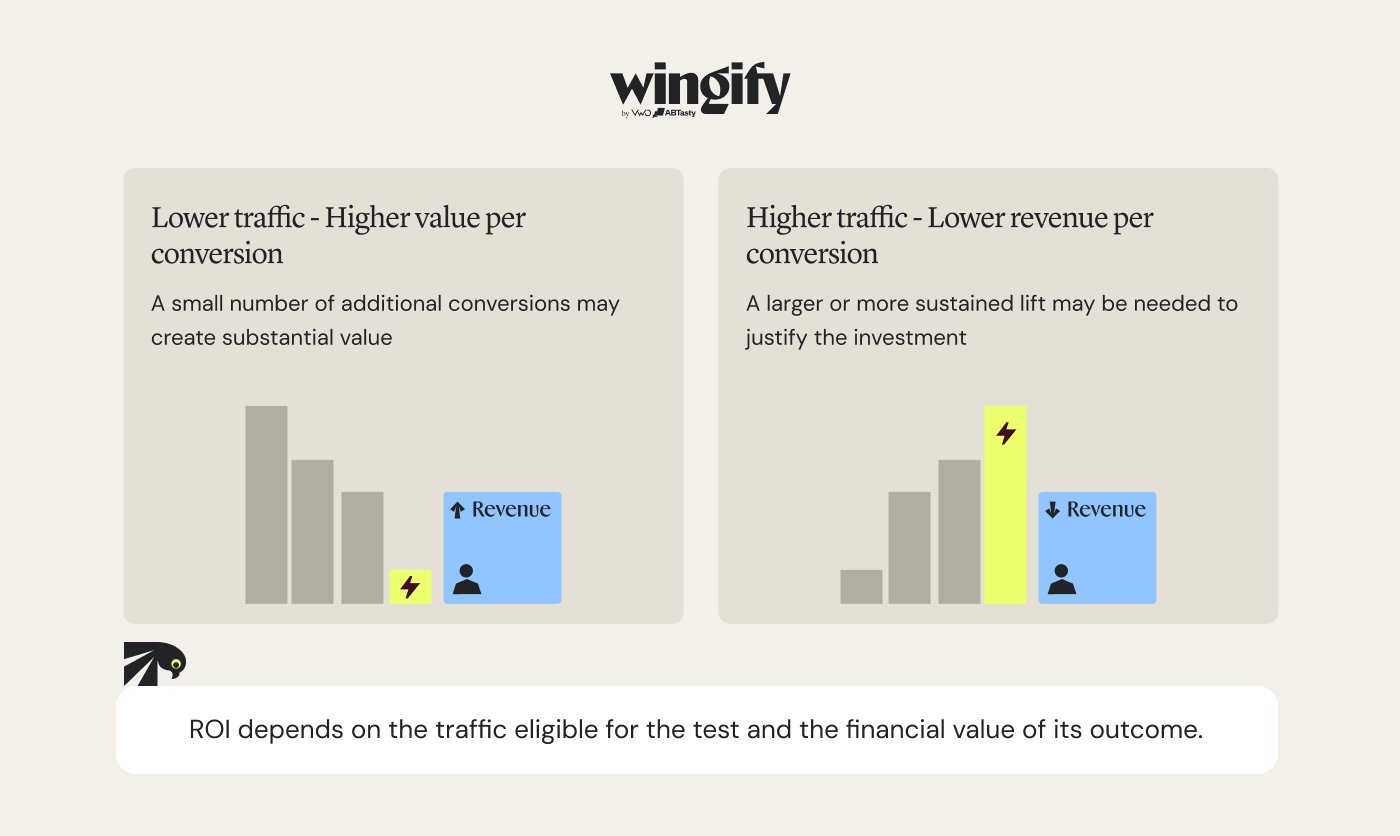
This also explains why traffic alone cannot predict ROI. A lower-traffic B2B or subscription business may generate substantial value from a small number of additional conversions when deal size or customer lifetime value is high. High-traffic websites with low revenue per visitor may need a larger or more sustained improvement to justify the same platform investment.
More eligible traffic can shorten test duration, increase annual testing capacity, and deploy validated improvements sooner, increasing the opportunity to realize their financial value. It can also help teams detect smaller but commercially meaningful effects and test distinct customer segments separately.
However, total website traffic is not the deciding measure. Testing capacity depends on eligible traffic, baseline conversion rate, minimum detectable effect, number of variations, and the required statistical significance threshold.
How A/B testing ROI varies by traffic tier
Traffic capacity affects how many experiments an enterprise can validate and deploy, which in turn affects how much value it can realize from its platform investment. Fixed visitor thresholds can be misleading. Two websites with the same monthly traffic may have very different conversion volumes and sample-size requirements.
Traffic capacity
What the program can support
Primary ROI focus
Constrained
A limited number of longer-running experiments
Test larger changes, use high-volume metrics, and limit variations
Sufficient
A steady sequence of reliable experiments
Improve hypothesis quality, test velocity, and deployment rate
High
Concurrent experiments across separate audiences, products, or journeys
Coordinate experiments, control audience overlap, and scale across teams
Determine the appropriate tier through a sample-size calculation for the specific page, audience, and conversion event under test, not total monthly visitors alone.
Traffic creates testing capacity. Revenue determines what a validated improvement is worth. ROI depends on how reliably the program converts one into the other.
Pro Tip!
Use Mutually Exclusive Groups in Wingify to prevent overlapping experiments from skewing results, helping enterprise teams allocate traffic efficiently, make more reliable investment decisions, and maximize ROI from testing.
Common ROI blockers of enterprise A/B testing
High traffic and revenue create ROI potential, but several operational and measurement gaps can prevent the organization from realizing that value.
Blocker
What happens
Impact on ROI calculation
Hypothesis starvation
Teams may have enough traffic to run tests but exhaust their supply of high-value hypotheses. Testing capacity remains unused, or the backlog shifts toward low-confidence ideas.
Reduces the number of credible gains the program can generate
Underpowered tests
Tests launched without sufficient eligible traffic or a pre-calculated sample requirement may fail to produce statistically significant results or generate unstable findings that should not guide deployment.
Increases costs without producing reliable gains
Double-counted uplift
Overlapping experiments on the same users or funnel stages each claim their own lift, so the same conversion is attributed to multiple tests.
Inflates reported gains and ROI
No program-level measurement
Each test’s control group validates a specific variation but cannot accurately measure the testing program’s cumulative impact. Without a persistent holdout or another credible measurement method, experimentation gains can be confused with seasonality, organic growth, campaigns, or other marketing efforts.
Makes program-level gains difficult to attribute
Deployment lag
Winning variants may remain undeployed or reach only part of the eligible audience. Delays create opportunity costs by shortening the period available to realize its value and may allow the original testing context to change before rollout.
Delays or reduces realized gains
Low platform utilization
The organization pays for enterprise-scale capabilities but runs too few valuable experiments or uses too little of the platform to generate a proportionate return.
Leaves the platform investment unmatched by measurable gains
No downstream revenue tracking
A lift in sign-ups or form completions cannot support a defensible financial-gains figure unless the platform’s reporting features connect it with revenue, average order value, margin, lifetime value, or CRM-tracked pipeline outcomes.
Prevents test outcomes from being converted into credible financial gains
Primary-metric wins that hide downstream losses
A variation improves the headline metric but reduces order value, margin, retention, or another important guardrail metric. Counting the initial uplift alone overstates its contribution.
Overstates gains and inflates ROI
Underreported program costs
The ROI calculation includes the license fee but excludes implementation, engineering, QA, analytics, training, governance, or agency costs.
Understates costs and inflates reported ROI
Low utilization can be an operating-model problem before it becomes a headcount problem. In thisWingify session on scaling experimentation with an existing team, Getolo CRO Lead Siyu Luo explains how design, development, marketing, and content teams can work as a shared experimentation practice without creating a new team.
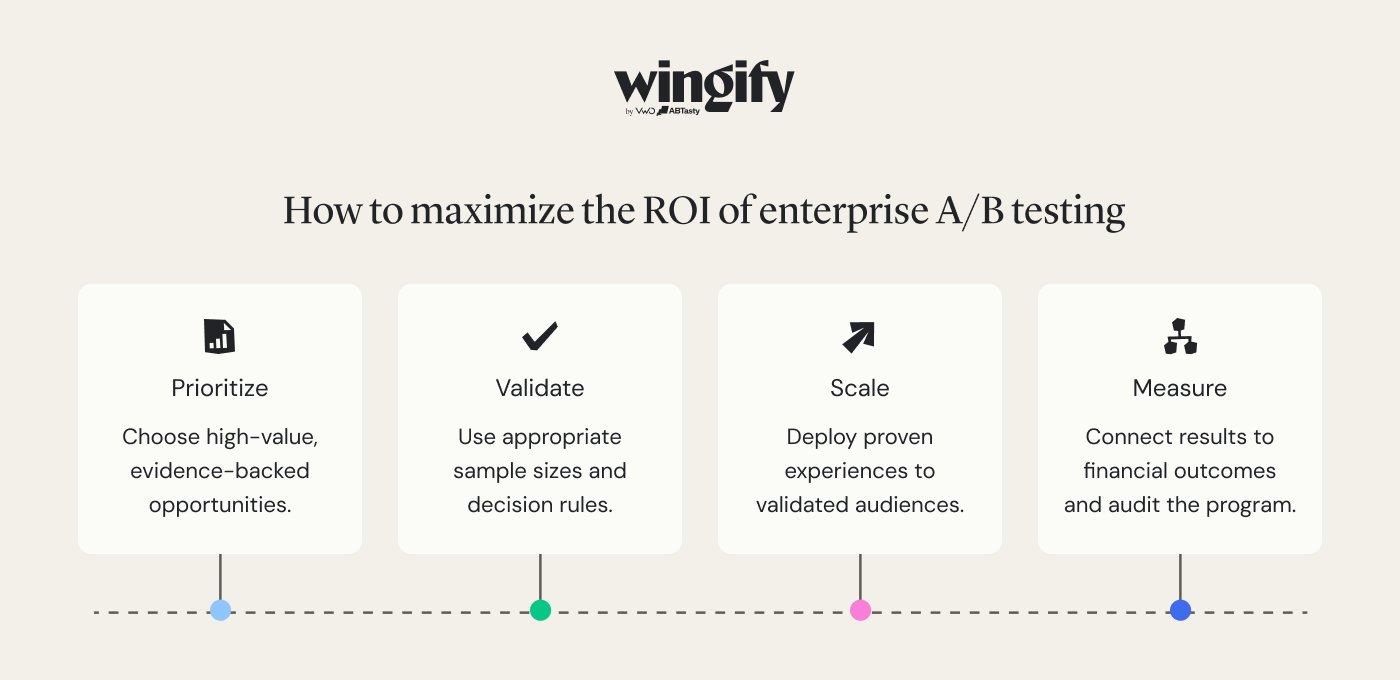
How to maximize the ROI of enterprise A/B testing
Improve ROI by making data-driven decisions about which opportunities to prioritize, reaching reliable conclusions efficiently, and connecting test results with financial outcomes.
1. Prioritize with ROI-weighted scoring
Rank hypotheses by financial impact, supporting evidence, eligible traffic, and implementation effort.
Focus on data-backed friction in high-value journeys, such as cart abandonment during checkout, onboarding drop-offs, pricing, upgrades, and lead generation.
Fix confirmed bugs, compliance issues, and tracking gaps without using testing capacity.
Want to make business impact the starting point of every experiment?Watch the webinarto learn how measurable outcomes, stakeholder alignment, and focused hypotheses can guide a higher-value experimentation program.
2. Accelerate decisions with valid statistical rules
Calculate sample size and minimum detectable effect before launch.
Use sequential testing or predefined stopping rules for efficacy and futility where the statistical model supports them.
Set decision thresholds in advance based on the method, business risk, and cost of incorrect decisions.
Consider multi-armed bandits when the objective is to direct more traffic toward better-performing experiences during the experiment. Measure their value separately from conventional A/B tests because traffic allocation changes dynamically.
3. Scale validated gains with segmentation and personalization
Test predefined segments when user behavior differs meaningfully by device, location, customer status, acquisition source, or previous interactions.
Deliver a winning experience only to the audience for which you’ve validated its effect.
Avoid acting on post-test subgroup findings without further validation.
Wingify Personalization lets teams build audiences using behavioral, contextual, and customer signals, then deliver validated experiences to the relevant segments. Audience-level reporting helps teams assess whether an experience continues to perform for a specific group, supporting more targeted deployment.
Watch the webinarto learn how to prioritize customer data, identify personalization opportunities, and build toward measurable ROI.
4. Connect leading indicators to financial outcomes
To demonstrate marketing ROI, connect key digital marketing metrics, such as bounce rates, clicks, engagement, and form completions, to revenue, margin, qualified pipeline, retention, or customer lifetime value.
Set clear goals and define how the primary metric, guardrails, and financial outcomes connect before launching the test.
Use guardrail metrics to detect losses hidden behind an improvement in the primary metric.
5. Audit the experimentation program regularly
Review key metrics such as the inconclusive-test rate, time to decision, winner deployment rate, platform utilization, and realized value.
Redirect resources away from consistently low-yield testing areas.
Wingify brings Analytics, Experimentation, Personalization, and Feature Management together on a shared foundation. Wingz can analyze behavioral, statistical, and historical data and summarize it into stakeholder-ready reports, helping teams review what worked, what was deployed, and where to focus ongoing optimization next.
Beyond revenue: Other ways to measure platform ROI
Revenue uplift is central to a budget conversation, but it is not the only value an enterprise experimentation platform produces. These measures support the revenue calculation, and some can be converted into financial value.
1. Commercial losses prevented
Estimate the loss avoided when testing identifies a harmful change before full rollout. Include it only when the change was likely to launch, and you can credibly estimate its impact.
Avoided loss = Expected affected volume × Estimated loss per affected user or transaction
2. Engineering and operational savings
Measure hours saved through an intuitive interface, visual editing, reusable components, automated QA, feature flags, integrations, and controlled rollouts.
UseWingzto accelerate idea and hypothesis generation, experiment prioritization, and identification of high-impact opportunities. If you want to quantify the efficiency benefit, measure the time your team actually spends on these activities before and after adopting Wingz. Report any verified reduction in hours separately from the potential business value of getting higher-impact experiments to market faster.
3. Faster decision-making
Track the time from hypothesis approval to a reliable decision and from that decision to deployment. Faster cycles can accelerate launches, reduce approval delays, and free resources for other experiments.
4. Release risk reduction
Track production incidents, emergency rollbacks, downtime, refunds, support demand, and users exposed to harmful variations. Where credible baselines exist, estimate the cost avoided through controlled testing and rollout.
Wingify Feature Management supports scheduled and segmented progressive rollouts of new features, automated rollbacks, and an auto-killswitch that can pause a release when defined metrics breach a threshold. These controls limit exposure to harmful changes and make avoided incident costs easier to identify.
5. Platform utilization
Compare experiments completed, teams using the platform, concurrent capacity used, and winner deployment rate against platform and operating costs.
The guide to scaling A/B testing covers test velocity and implementation-rate benchmarks in greater detail.
6. Budget accuracy
Compare projected platform, staffing, implementation, and operating costs with actual spend. Excluding or underestimating these costs inflates reported ROI.
7. Customer and product outcomes
Track adoption, task completion, retention, CES, or NPS when you define them as experiment goals. Report them separately when you can’t credibly translate them into financial value.
8. Knowledge reuse
Track how often findings from user research and previous experiments inform new hypotheses, prevent duplicate work, or support decisions across teams.
What separates strong teams from busy teams is that they treat learning as a reusable asset. Every test should make the organization smarter, even when it fails. If an experimentation program does not improve the quality of future decisions, it is just noise wrapped in process.
Andres Pinate, Marketing Director | Strategic Consultant in CRO & Growth (Source:Expert Interviews)
Don’t force every benefit into a financial figure. Report monetized outcomes, such as cost savings and avoided losses, separately from operational, customer, and organizational indicators. This keeps the ROI calculation defensible while showing the platform’s wider enterprise value.
Final thoughts: Turn experimentation into measurable enterprise value
Enterprise A/B testing ROI depends on more than winning tests. It comes from selecting valuable opportunities, reaching reliable decisions, deploying results efficiently, and connecting them with financial and operational outcomes.
Wingify, the Agentic Experience Optimization Platform, brings Experimentation, Analytics, Personalization, and Feature Management together on a shared foundation. Wingz, its intelligence layer, helps teams identify high-value optimization opportunities and turn behavioral and experimentation data into actionable insights. By connecting insights with testing, targeted personalization, and controlled rollouts, Wingify helps enterprises make better use of their experimentation investment, realize more value from validated improvements, and build a clearer picture of the program’s business impact.
Request a demo to see how Wingify can support a connected, scalable, and measurable experimentation program.
FAQs
What is a typical ROI for an enterprise A/B testing platform?
There is no reliable “typical” ROI for an enterprise A/B testing platform. Mature programs can generate multi-fold returns, and a high-impact winning experiment may sometimes offset a substantial share of the annual platform cost. However, calculate ROI from the organization’s own deployed gains, avoided losses, and fully loaded program costs, not a generalized benchmark.
How long does it take to see ROI from an enterprise A/B testing platform?
Successful tests may identify winning variations within weeks, but realized ROI begins only after those variations are deployed, and their financial impact is confirmed. A credible program-level assessment usually requires several cycles of continuous testing and can be reviewed quarterly.
How many A/B tests can an enterprise team run at once?
There is no fixed limit. Concurrent A/B and multivariate testing depends on eligible traffic, required sample size, audience overlap, shared metrics, and engineering and QA capacity. Teams can run multiple tests safely when audiences are separated, or when interaction effects are actively controlled.
Hi, I’m Pratyusha Guha, manager - content marketing at VWO. For the past 6 years, I’ve written B2B content for various brands, but my journey into the world of experimentation began with writing about eCommerce optimization. Since then, I’ve dived deep into A/B testing and conversion rate optimization, translating complex concepts into content that’s clear, actionable, and human. At VWO, I now write extensively about building a culture of experimentation, using data to drive UX decisions, and optimizing digital experiences across industries like SaaS, travel, and e-learning.
You might also love to read these on A/B Testing
15 Min Read
How to Analyze A/B Test Results in a Free Tool Accurately
15+ Min Read
Implementing A/B Testing Without a Dedicated Tool: How It Works
15+ Min Read
How to Interpret A/B Test Results From Your Testing Platform (Step-by-Step Guide)