A pricing page test isn’t the same as testing a headline or changing a CTA color.
Your pricing page does more than communicate value. It shapes how visitors perceive that value, compare plans, and decide whether your product is worth paying for. A small change to your pricing model, packaging, or plan structure can influence not just conversions, but also average order value and the quality of customers you acquire.
That makes pricing page experimentation a higher-stakes exercise. You need to understand how different audiences respond to pricing changes, validate their impact on revenue, and roll out winning variations without exposing your entire customer base to unproven changes.
A basic A/B testing tool may help you compare two page variations, but effective pricing experimentation requires more: reliable testing, behavioral insights, audience-level personalization, and controlled rollouts.
Whether you’re testing pricing models, restructuring plans, or experimenting with subscription offers, this guide will help you choose the right A/B testing platform for your pricing experiments.
Why A/B testing is critical for pricing page optimization
Your pricing page sits directly at the intersection of visitor intent and actual revenue. Here’s why running structured price testing is essential:
1. Direct impact on revenue & profit margins
Pricing is your most aggressive growth lever. Small, disciplined changes to price or packaging move revenue more directly than almost any other on-site change, making pricing tests one of the most effective ways to improve monetization.
Example: Switching your default display from monthly to annual billing (with a “Save 20%” badge) can instantly bump upfront cash flow and increase Average Revenue Per User (ARPU) without changing base prices.
2. Improves conversions by removing friction
Visitors drop off when pricing tables are overwhelming or confusing. Testing visual hierarchy and copy clarity helps turn high-intent traffic into paid accounts faster.
Example: Highlighting a single plan as “Most Popular” or reducing a 6-column pricing table down to 3 core tiers guides hesitant users toward a clear decision.
3. Reduces early churn by setting accurate expectations
When users sign up under misleading or vague tier promises, they churn quickly. Clear feature breakdowns align buyer expectations with actual product capabilities from day one.
Example: Clarifying usage limits (e.g., “Up to 10,000 monthly events”) directly on the pricing cards, rather than hiding them in fine print, reduces mid-month cancellations.
4. Reveals true value perception across customer segments
Internal teams often guess what customers value most. Split testing exposes what features different audience segments are actually willing to pay for.
Example: Testing whether SaaS buyers respond better to per-seat pricing vs. feature-gated plans reveals whether your market prioritizes team collaboration or specific advanced functionality.
5. Protects brand trust during major pricing changes
Transitioning pricing models, like moving from flat-rate to usage-based, carries risk. Testing changes on a small traffic segment prevents customer backlash and protects existing revenue.
Example: Rolling out a new tiered structure to just 10% of new site visitors allows you to measure conversion impact and gather feedback before announcing it to your entire customer base.
A/B testing replaces subjective internal debates with real behavioral data, enabling data-driven decisions that keep your team focused on what actually works.
Example: Instead of arguing whether to show or hide enterprise pricing, you can run a split test comparing a “Contact Us” CTA against a “Book a Demo with Pricing Calculator” form.
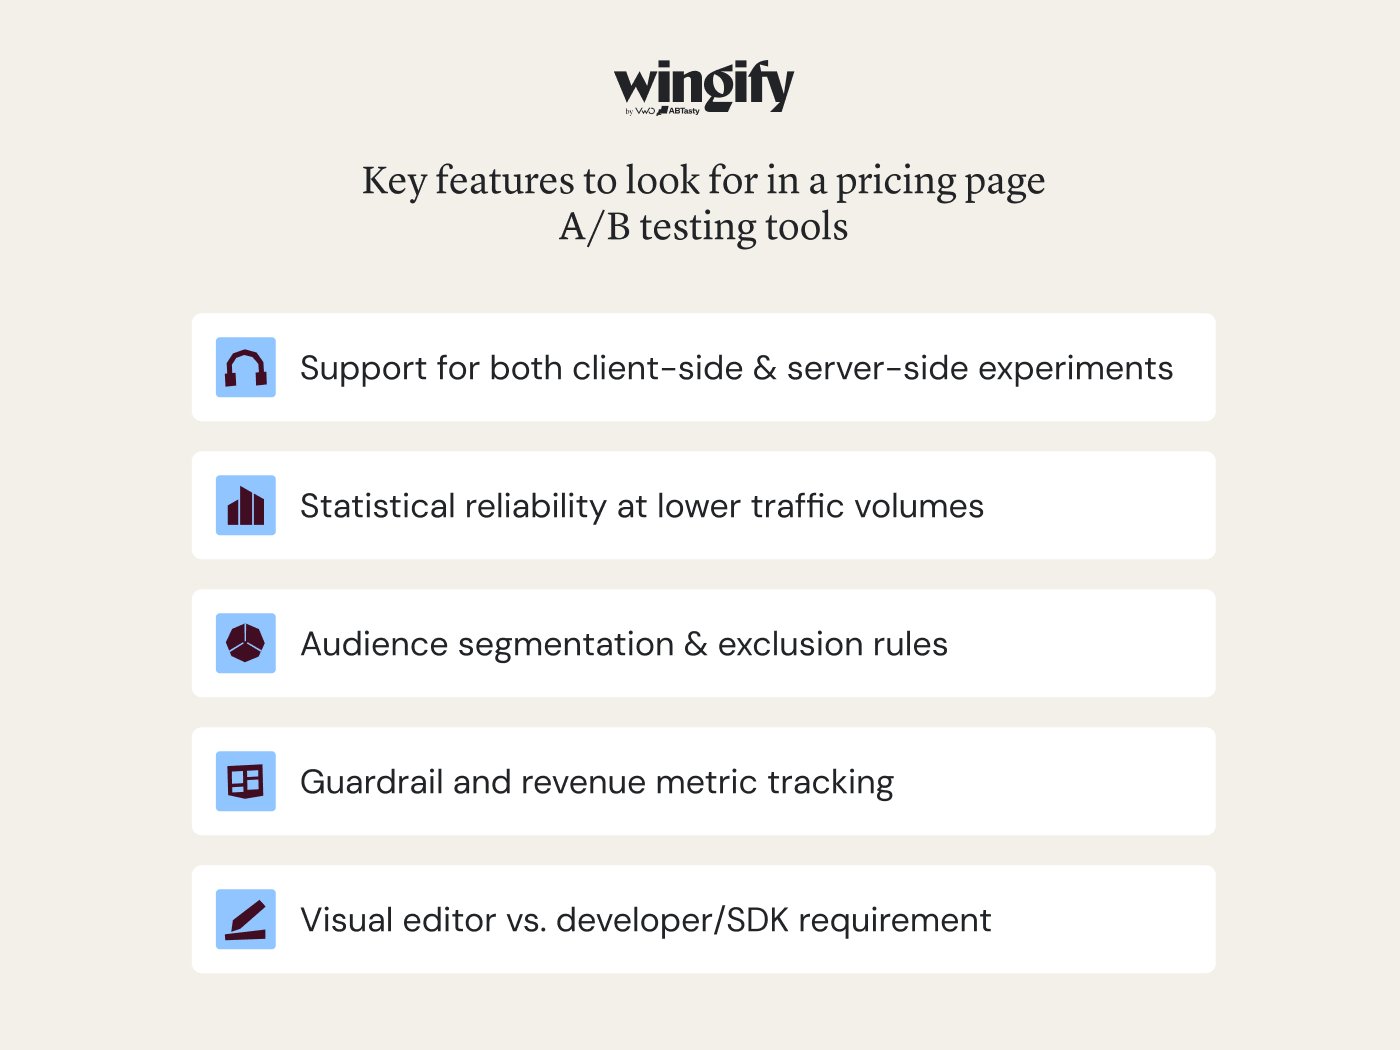
Key features to look for in pricing page A/B testing tools
Generic CRO feature lists don’t always apply to pricing experimentation. A visual editor and a significance calculator matter for any test, but pricing pages introduce requirements a headline test never triggers: price accuracy, customer exclusion, and guardrail tracking chief among them. Here’s what to evaluate specifically for this use case.
1. Support for both client-side and server-side experiments
Changes to a new pricing page, including plan layouts, feature comparison tables, CTA placement, or trust signals, can usually be handled through a visual editor using client-side experimentation.
However, experiments involving actual price points, billing models, discounts, or pricing logic often require developer support through server-side experimentation using SDKs, APIs, or feature flags, as these changes are typically controlled by your backend systems.
Choose a platform that supports both approaches so marketing teams can launch straightforward UI experiments independently while technical teams can safely validate backend pricing logic without compromising website performance. This ensures your experimentation program isn’t limited by technical constraints as it matures.
Graduating to server-side experimentation requires a cultural and structural evolution. Before investing in advanced infrastructure, an enterprise must possess a mature culture of data-driven decisioning and an appetite for scaled testing to justify the ROI. This demands a robust change management plan that prioritizes training, education, and clear stakeholder incentives to accelerate platform adoption.
Apurva Sandbhor, Manager – Platform & Product Experimentation, The Home Depot (Source: CRO Perspectives)
2. Statistical reliability at lower traffic volumes
Pricing pages typically see less traffic than a homepage or top-of-funnel landing page, but each conversion carries more revenue weight. This makes statistical reliability especially important.
Look for tools that use robust statistical methods to help distinguish genuine improvements from random variation across test groups. Whether the platform uses Bayesian or Frequentist statistics, it should provide clear confidence measures so you can make pricing decisions with confidence instead of relying on directional trends.
Pro Tip!
Wingify’s enhanced SmartStats engine combines Bayesian-powered sequential testing with built-in checks for issues like peeking and multiple comparisons. It also lets you configure parameters such as Minimum Detectable Effect (MDE), statistical power, and guardrail metrics based on the importance and risk level of your pricing experiment.
3. Audience segmentation and exclusion rules
Pricing experiments rarely need to run for every visitor. Instead, they should target specific user segments. You may want to test a new pricing model only for first-time visitors, users from a specific country, or traffic from a particular acquisition channel while excluding existing customers from the experiment.
The relevant tool should provide granular audience segmentation, exclusion rules, and flexible traffic allocation so you can safely validate pricing hypotheses before expanding them to a broader audience.
4. Guardrail and revenue metric tracking
Every experiment should define a primary success metric and guardrail metrics. While the primary metric measures whether the experiment achieved its objective, guardrail metrics help ensure improvements in one area don’t negatively impact other critical business metrics.
For pricing tests, the tool should let you track primary metrics alongside guardrail metrics such as churn, refund rate, profit margins, and customer lifetime value to detect unintended negative impacts.
5. Integration with billing and revenue platforms
Pricing experiments don’t end at the pricing page. To measure business impact accurately, your testing platform should integrate with payment gateways, subscription management systems, billing platforms, and analytics tools such as Google Analytics so you can track revenue-related outcomes beyond the initial conversion.
Look for integrations that let you measure metrics such as revenue per visitor, average order value, trial-to-paid conversions, subscription upgrades, renewals, and churn. Connecting experimentation data with your billing and revenue systems helps ensure pricing decisions are based on long-term business impact, not sign-ups alone.
Wingify is an Agentic Experience Optimization Platform that brings experimentation, feature management, personalization, and analytics together to help businesses optimize every stage of the customer journey, from pricing pages and checkout flows to feature releases and personalized experiences. Powered by Wingz, its embedded AI layer, the platform connects insights to action by helping teams identify opportunities, generate hypotheses, execute optimization workflows, and learn from outcomes, enabling a continuous cycle of experience improvement.
Key features
Experimentation: Create and run A/B tests, split URL tests, and multivariate tests to compare different versions of pricing page layouts, messaging, CTAs, pricing structures, and offers. SmartStats provides statistically rigorous analysis to support confident experimentation decisions.
Feature Management: Test and progressively release pricing-related product changes, such as subscription plans, discount logic, billing flows, and checkout experiences, using feature flags and controlled rollouts. This allows product and technical teams to validate changes throughout the feature lifecycle while reducing release risk.
Analytics: Use heatmaps, session recordings, journey analytics, form analytics, and user feedback to generate visual insights into how visitors interact with pricing pages, identify friction points, and turn behavioral observations into stronger experimentation hypotheses and uncover opportunities for conversion optimization.
Personalization: Create more relevant pricing experiences using customer, behavioral, and predictive signals. Data Studio activates CRM data for targeted audiences; Predictive Data identifies visitor intent and affinities; Emotions adds emotional context to pricing decisions; and Segmentation & Targeting delivers tailored messages, offers, and experiences to relevant audiences.
Commerce: Make product discovery more relevant to shopper intent. Search uses semantic AI to surface relevant products; Recommendations adapts suggestions using current and past behavior; Merchandising controls product visibility and rankings; and Commerce Report connects placements and strategies to revenue, AOV, and margin guardrails.
Additional features:
Audience targeting and segmentation
Bayesian and Frequentist statistical methods
Mutual exclusion groups
Traffic allocation and scheduling
Cross-platform experimentation (web, mobile, and feature)
Feature flags and controlled rollouts
SDKs for web, mobile, and backend applications
Integrations with analytics, CDPs, CRM platforms, and data warehouses
Custom goals and conversion tracking
No-code visual editor
Real-time analytics and experiment reporting
Role-based collaboration and access controls
Enterprise security and governance
Pricing
Free trial: All-inclusive 30-day trial available.
Paid: MTU-based custom plans available on request.
Pros & Cons
Pros:
Tracks visitor volume and experiment progress, helping product teams decide when to launch winning page variations.
Cons:
Getting the most from advanced testing capabilities requires some familiarity with the platform.
Optimizely is an enterprise-grade experimentation platform built for high-volume, statistically rigorous testing, making it well-suited for organizations running concurrent pricing experiments across teams and regions.
Key features
Agentic experimentation
A/B, feature & server-side testing
Multivariate testing
Feature management
Proprietary statistical engine for experiment analysis
Real-time audience targeting and personalization
Analytics with AI-accelerated insights – Product and experimentation
Integrations with analytics, CDPs, and business intelligence tools
Pricing
Customized plans are available on request.
Pros & Cons
Pros:
Easy to use, with efficient APIs and automated audience management that streamline experimentation.
Cons:
Report filtering and raw data export could be more streamlined for advanced analysis.
GrowthBook is a warehouse-native experimentation platform that runs statistical analysis directly on your existing data warehouse, eliminating data duplication while ensuring complete data ownership, trusted metric definitions, and transparent experiment results.
Key features
AI visual editor
A/B, split URL testing
Flexible experiment types (code-based and no-code)
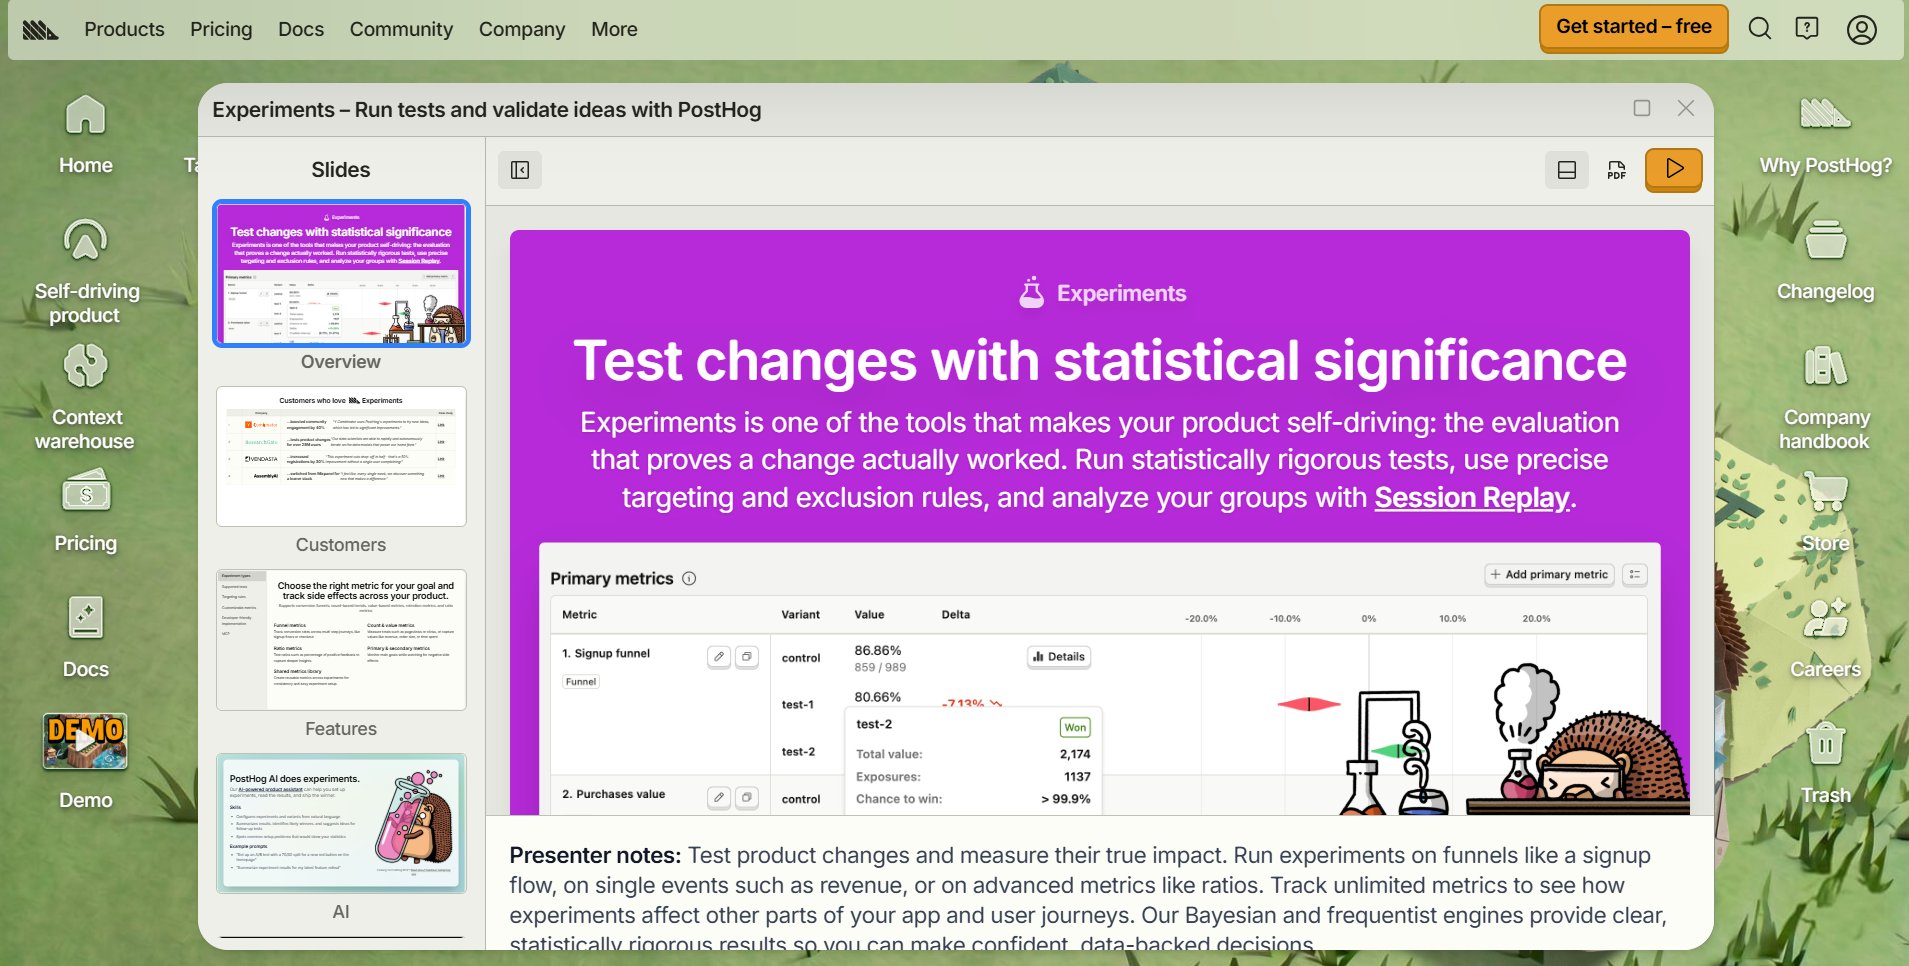
PostHog combines experimentation, product analytics, and session replay, making it easy to connect pricing experiments with downstream activation and subscription outcomes.
Key features
A/B, A/A, A/B/N testing
Visual editor
Feature flags
Web & product analytics
Heatmaps
Session replays
Customizable metrics
AI-powered product assistant
Bayesian and Frequentist statistical methods
Holdout testing
Mutually exclusive experiments
Audience targeting
Pricing
Free plan: Monthly tier with capped usage and 1 project
Paid: Usage-based after free tier
Pros & Cons
Pros:
Provides powerful visibility into user behavior with session recordings, funnels, feature flags, and event analytics in a developer-friendly platform.
Cons:
The interface can become overwhelming as you adopt more features, and query performance may slow with larger datasets.
Kameleoon is an enterprise experimentation platform built for organizations running sophisticated experimentation programs, with strong support for pricing, product, and feature experiments.
Key features
Prompt-based experimentation
Sequential testing
Server-side testing
Mutually exclusive groups/holdouts
SRM detection
Feature management
Feature rollouts
Segmentation & personalization
Bayesian & frequentist methods
CUPED
Pricing
Free plan: PBX Starter available for 30 days.
Paid: Plans start from $495/month
Pros & Cons
Pros:
PBX makes it easy to launch A/B tests and website customizations independently, with AI significantly accelerating experiment creation.
Cons:
The platform’s interface and terminology can make the initial onboarding experience less intuitive.
How to run A/B tests on pricing pages without hurting conversions
Choosing the right A/B testing tool is only part of a successful pricing experiment. Pricing pages directly influence revenue, customer trust, and long-term business performance, so every experiment should follow a structured process. The framework below helps you validate pricing decisions while minimizing business risk.
Step 1: Define a clear pricing hypothesis
Every pricing experiment should begin with a specific, measurable hypothesis rather than a hunch. Clearly define what you’re changing, why you expect it to improve business outcomes, and how you’ll measure success.
For example:
“Offering a 15% annual billing discount instead of 10% will increase annual subscriptions without reducing revenue per visitor,” not “let’s see if a bigger discount helps.”
Keep each experiment focused on a single variable. Testing multiple pricing elements simultaneously, such as various price points, billing frequency, plan hierarchy, and CTA messaging, may produce a result, but it won’t tell you which change influenced customer behavior.
This split also determines the infrastructure you need: framing and layout tests can usually run on a client-side visual editor; price and model tests typically need server-side delivery.
Step 2: Start with pricing presentation before testing the actual price
How you present a price often matters more than the price itself. Testing pricing table layout, plan hierarchy, feature grouping, billing frequency, trust signals, or “Most Popular” badges is just the starting point before changing actual price points.
For example, NRMA Parks and Resorts tested exactly this: reframing a total booking cost as an average nightly rate, with no change to the actual price or offer, lifted purchases by 18%, add-to-cart by 68%, and checkout entry by 19%.
Framing experiments like this are typically lower-risk, faster to reverse, and often deliver the larger effect, which is why they belong earlier in the sequence, not as an afterthought once price-point testing is underway.
Step 3: Target the right audience
Exclude existing customers before launching the experiment. Showing current subscribers or logged-in users different prices from what they originally agreed to can create confusion, increase support requests, and damage customer trust.
Use audience targeting to test pricing hypotheses on specific visitor segments, such as new users, particular geographies, or acquisition channels, to improve the relevance of your results before expanding the experiment to a broader audience.
Note: If the experiment shows different prices across regions or segments, confirm it complies with local consumer-protection and price-disclosure rules before launch; this check belongs in test design, not as an afterthought once a variant has already shipped.
Step 4: Define success metrics before launching the experiment
Monitor business-focused metrics such as:
Revenue per visitor (RPV)
Average revenue per user (ARPU)
Average order value (AOV)
Trial-to-paid conversion rate
Plan distribution
Upgrade and downgrade rates
Alongside these, identify a small set of guardrail metrics that should remain stable during the experiment. These metrics help detect unintended side effects, such as higher churn, lower profit margins, increased refund rates, or reduced customer lifetime value, even if the primary metric improves.
Step 5: Prepare the experiment for reliable results
Before you start testing, use your testing tool’s sample size calculator to estimate how much traffic and time you’ll need to collect enough data to reach statistical significance. Pricing pages often receive lower traffic than homepages or top-of-funnel landing pages, making this planning step especially important.
While the experiment is running, avoid introducing external factors that could influence the results. Major marketing campaigns, seasonal promotions, product launches, or significant changes in traffic sources can all distort the true impact of your pricing variation.
Step 6: Analyze the results before declaring a winner
Once the experiment reaches statistical significance, evaluate your test results against the key metrics you defined before launch. Resist the temptation to focus solely on conversion rate.
A lower-priced variation may increase sign-ups while reducing average revenue per user, whereas a premium-priced variation could generate fewer conversions but significantly higher revenue per visitor. Review both your primary metric and guardrail metrics to understand the full business impact before deciding.
Where possible, complement quantitative results with behavioral insights such as session recordings, heatmaps, or customer feedback. These often explain why a variation succeeded or failed, helping you design stronger pricing experiments in the future.
Step 7: Roll out the winner in phases
Even after identifying a winning variation, use gradual rollouts instead of deploying it to all visitors immediately. Start with a phased rollout to a small percentage of eligible traffic while continuing to monitor conversion rate, revenue, plan mix, support ticket volume, and other guardrail metrics.
Once the results remain consistent and your guardrail metrics remain healthy, you can confidently expand the rollout to all eligible visitors.
Note: Before trusting results from a newly implemented experimentation setup, consider running an A/A test, where both groups see the same pricing page. If the experiment reports a statistically significant difference between identical experiences, the issue is likely with the testing setup or data pipeline, not your pricing hypothesis. Catching these issues early can prevent costly pricing decisions based on inaccurate data.
Watch this webinar to learn how to treat pricing as a structured growth lever rather than a guess, with a practical walkthrough of setting up a pricing experiment end to end.
Choosing the right A/B testing tool for pricing pages
There isn’t a single best tool for every business. Different pricing experimentation scenarios call for different capabilities. Use the table below to identify the platform type that best fits your team and business.
If your team…
Prioritize a platform that offers…
Optimizes pricing presentation(common for eCommerce and marketing-led businesses): testing pricing tables, plan hierarchy, feature comparisons, CTA messaging, or trust badges.
Client-side experimentation, a visual editor, behavioral analytics, and minimal engineering dependency.
Experiments with pricing logic(common for B2B SaaS and PLG businesses): testing price points, subscription tiers, billing frequency, discount rules, or usage-based pricing.
Everything above plus server-side experimentation, backend integrations, feature flags, and support for consistent pricing across checkout and billing systems.
Runs enterprise-scale experimentation(common for large organizations managing multiple products, regions, or teams).
Everything above plus advanced statistical methods, governance controls, mutual exclusive campaigns, audience segmentation, and collaboration features for large experimentation programs.
Before choosing a platform, verify these capabilities
Regardless of the platform you shortlist, make sure it supports these essential capabilities for pricing experimentation:
Backend and billing alignment: Can it integrate with your payment or subscription platform to measure revenue-focused metrics, not just clicks and conversions?
Audience exclusion: Does it provide flexible targeting rules to prevent existing customers or logged-in users from seeing experimental pricing?
Statistical reliability: Does it provide robust statistical methods that produce reliable results on lower-traffic pricing pages?
Flicker-free experimentation: Does it support server-side delivery or other techniques that prevent visitors from seeing prices change during page load?
Business metric tracking: Can it measure custom metrics or revenue-focused metrics such as revenue per visitor, average order value, or plan distribution alongside conversion rate?
Conclusion: Take the guesswork out of pricing optimization
The best pricing strategy is one that’s continuously validated. Whether you’re refining pricing presentation, testing subscription plans, or evaluating new pricing models, the right experimentation platform lets you test ideas safely, measure business impact, and roll out winning experiences with confidence.
If you’re looking for a platform that combines experimentation, behavioral insights, feature management, and personalization, Wingify gives you everything you need to test, learn, and optimize from a single platform. Start your 30-day free trial today or request a demo to get going.
FAQs
Why is A/B testing important for pricing pages?
A/B testing helps you validate pricing, packaging, and presentation changes based on real visitor behavior. It reduces the risk of making changes that may increase sign-ups but lower revenue, average order value, or customer trust.
What elements should I test on a pricing page?
You can test plan layout, pricing table structure, billing frequency, feature comparisons, CTA copy, trust signals, “Most Popular” badges, discount messaging, and different price points. Start with presentation changes before testing actual pricing logic. But avoid changing multiple variables in the same A/B test unless you’re intentionally running a multivariate experiment.
Can small businesses benefit from pricing page A/B testing?
Yes, small businesses can use pricing page tests to improve clarity, reduce decision friction, and learn which offers resonate with specific user segments. However, they need enough traffic and conversions to generate reliable results.
How often should I optimize my pricing page?
Continuously monitor user behavior and key business metrics, then run A/B tests when the data reveals a clear optimization opportunity. Wingify Analytics can uncover friction through heatmaps, scroll maps, session recordings, Journey Analytics, and form analytics, helping you prioritize high-impact pricing experiments instead of testing at random.
Hi, I’m Pratyusha Guha, manager - content marketing at VWO. For the past 6 years, I’ve written B2B content for various brands, but my journey into the world of experimentation began with writing about eCommerce optimization. Since then, I’ve dived deep into A/B testing and conversion rate optimization, translating complex concepts into content that’s clear, actionable, and human. At VWO, I now write extensively about building a culture of experimentation, using data to drive UX decisions, and optimizing digital experiences across industries like SaaS, travel, and e-learning.
You might also love to read these on A/B Testing
13 Min Read
How to Calculate ROI for an Enterprise A/B Testing Platform
15 Min Read
How to Analyze A/B Test Results in a Free Tool Accurately
15 Min Read
Implementing A/B Testing Without a Dedicated Tool: How It Works