Wingify Journey Analytics is the quantitative analytics layer built natively into the Wingify platform. It connects the numbers with behavioral context, so your team can find conversion friction, understand what’s behind it, and move straight into action.
Most analytics workflows split the job across different tools. One to tell you what happened, a second to understand why, and a third to test what you’ve learned.
The problem isn’t a lack of data. It’s the gap between finding insight and taking action.
Wingz connects these insights, helping your team move from investigation to informed action without losing context.
Close the gap between insight and action
Analytics, funnels, and recordings show what people did. Wingify User Feedback captures user feedback, so a hunch becomes a sharper hypothesis that leads to tests with better results.
Analyze without waiting on engineering
Wingify automatically captures relevant interactions, including page views, form submissions, and clicks, through a single smart code. There’s no need to define every event or wait for a new tracking request.
Since the data is captured from day one, you can also analyze it retroactively.
Give every insight more context
Drill down directly from a report to the relevant session recordings or heatmaps, so you can investigate the behavior behind a metric or drop-off without switching tools.
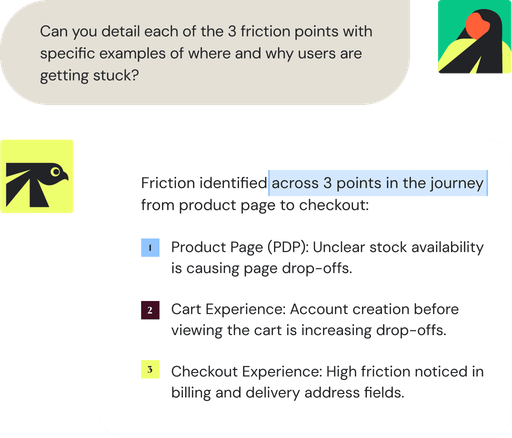
Wingz brings these signals together to investigate trends, identify potential friction, and generate optimization hypotheses.
Make decisions on complete data
Uses zero data sampling and tracks users according to a monthly active user model. Your teams can also account for seasonality when analyzing performance.
See how the pieces come together
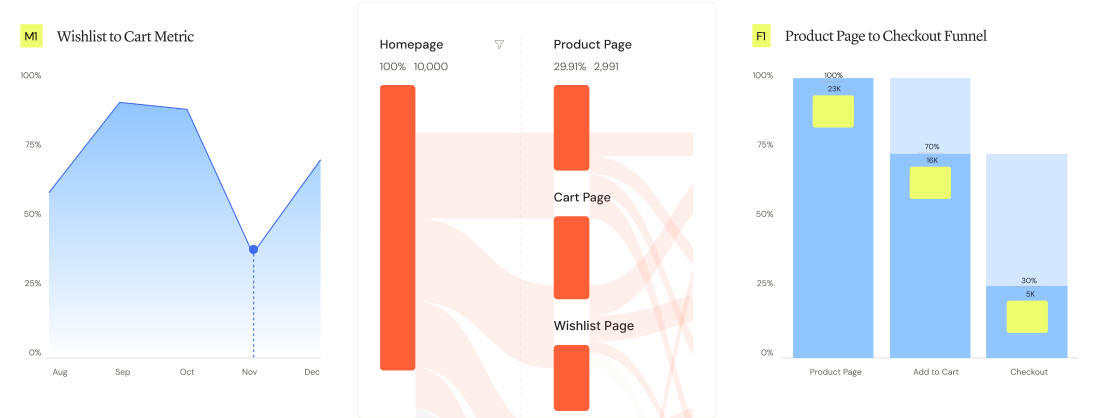
Wingify Journey Analytics gives you different ways to investigate a problem, depending on the question you’re trying to answer. Drill into the relevant session recordings and heatmaps from the same analysis, and use those learnings to run tests or personalize experiences.
Meet Wingz AI
Give your growth Wingz
Most analytics tools give AI access to only part of the story. Wingz works across your quantitative and behavioral data to highlight patterns, identify friction, and recommend tests. Every recommendation is grounded in the full picture, not a single data source.
Whether you’re starting without a dedicated analytics tool, looking for more from the data you already have, or adding a CRO layer to your existing stack, Wingify Journey Analytics adapts to how your team works.
Find and fix conversion friction
Find where visitors are dropping off, investigate the behavior behind it, and move directly into experimentation.
Answer new questions without new tracking
Explore behavioral and quantitative data as your questions evolve, without creating a new tracking request every time you want to investigate something new.
Go deeper with the data you already have
Use Wingify Journey Analytics alongside your existing analytics setup to connect quantitative insights with behavioral context and experimentation, without replacing what already works.
Key benefits
Get answers, faster
Analyze what’s happening without waiting for new tracking or digging through multiple tools.
Go from “what” to “why”
Connect metrics, funnels, journeys, recordings, and heatmaps to understand not just what changed, but what might be driving it.
See the full picture
Work with complete, unsampled data, so your analysis isn’t limited by sampling or a partial view of the customer journey.
Act on what you find
Turn insights into experiments faster. Identify an opportunity, decide what’s worth testing, and move toward optimization without breaking your workflow.
Powerful on its own. Even stronger as part of Wingify Analytics.
Start with what you need today and add more as you grow, all on one connected platform.
Wingify meets the highest security and data privacy standards across the globe, with 24/7 priority support.
Certified and compliant
We carry industry-leading certifications. Your data stays protected while helping you meet global and regional regulatory requirements with confidence.
Store your data where you need it
Data centers in the US, the EU, and India.
Support that you can count on
A dedicated success manager and technical experts, with 24/7 support and a consistent CSAT of 99%.
Wingify Journey Analytics is the quantitative analytics layer built into the Wingify platform. It tracks what's happening on your site or product, and connects those numbers to behavioral context like session recordings and heatmaps, so you can act on what you find without switching tools.
No, In Wingify Journey Analytics, a single smart code automatically captures relevant interactions, including page views, form submissions, and clicks. You don't have to define each event upfront or file a tracking request every time a new question comes up.
Yes, with Wingify Journey Analytics, you can. Since interactions are captured from day one, you can build a report and look back at historical data retroactively instead of waiting for new data to accumulate.
Wingz is Wingify's agentic AI layer, and it's connected to everything across the platform. It reads your quantitative and behavioral data together to highlight patterns, point to potential friction, and suggest hypotheses worth testing, rather than drawing conclusions from a single data source.
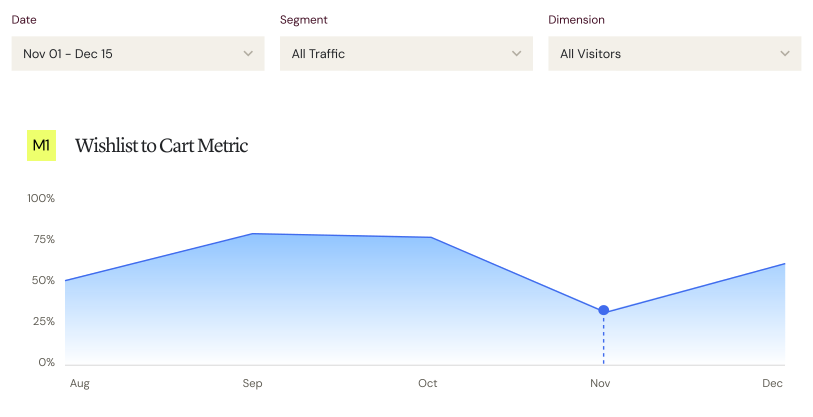
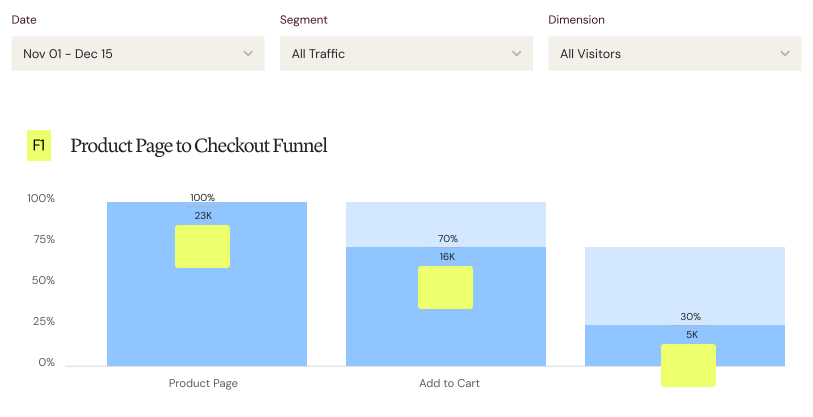
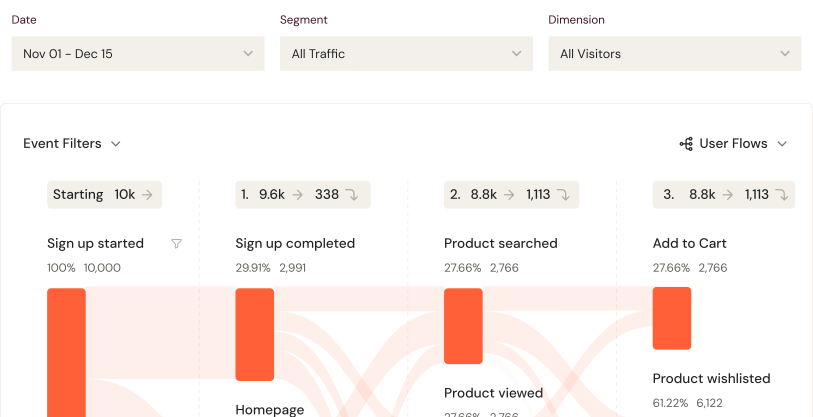
You can build different types of reports on Journey Analytics- metric reports for tracking events, unique users, and frequency over time; funnel reports for finding where a defined conversion path breaks down; journey reports for exploring the paths people take before or after a key event, including unplanned ones; and finally boards for keeping key views together in one place.
Yes, on Journey Analytics, you can drill down from a report straight into the relevant session recordings and heatmaps, so you can investigate why a drop-off is happening in the same workflow where you spotted it.
Hi 👋 Let's get you started
Free for 30 days. No credit card required.
We just need a few details
Curious how it works? Get a 1-on-1 demo
Thank you ,
your meeting is confirmed.
at
Your account is being set up
We've sent a message to yourmail@domain.com with instructions to verify your account.