Statistical hypothesis testing implies that no test is ever 100% certain: that’s because we rely on probabilities to experiment.
When online marketers and scientists run hypothesis tests, they’re both looking for statistically relevant results. This means that the results of their tests have to be true within a range of probabilities (typically 95%).
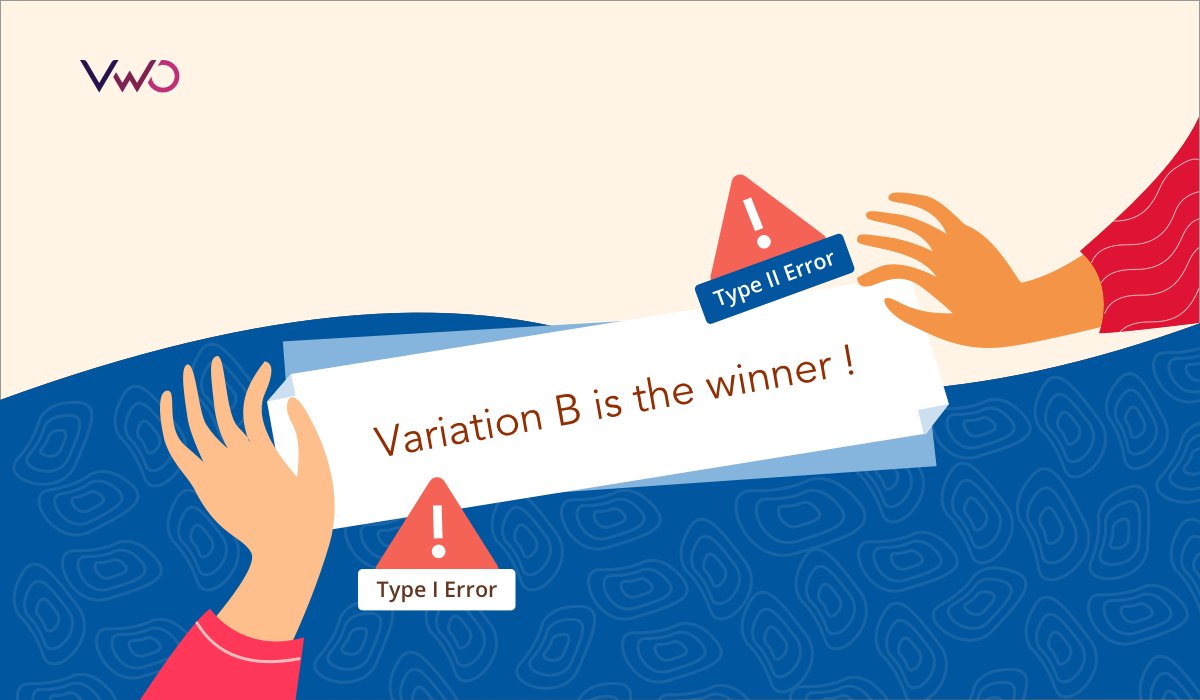
Even though hypothesis tests are meant to be reliable, there are two types of errors that can still occur.
These errors are known as type 1 and type 2 errors (or type i and type ii errors).
Let’s dive in and understand what type 1 and type 2 errors are and the difference between the two.
Understanding Type I Errors
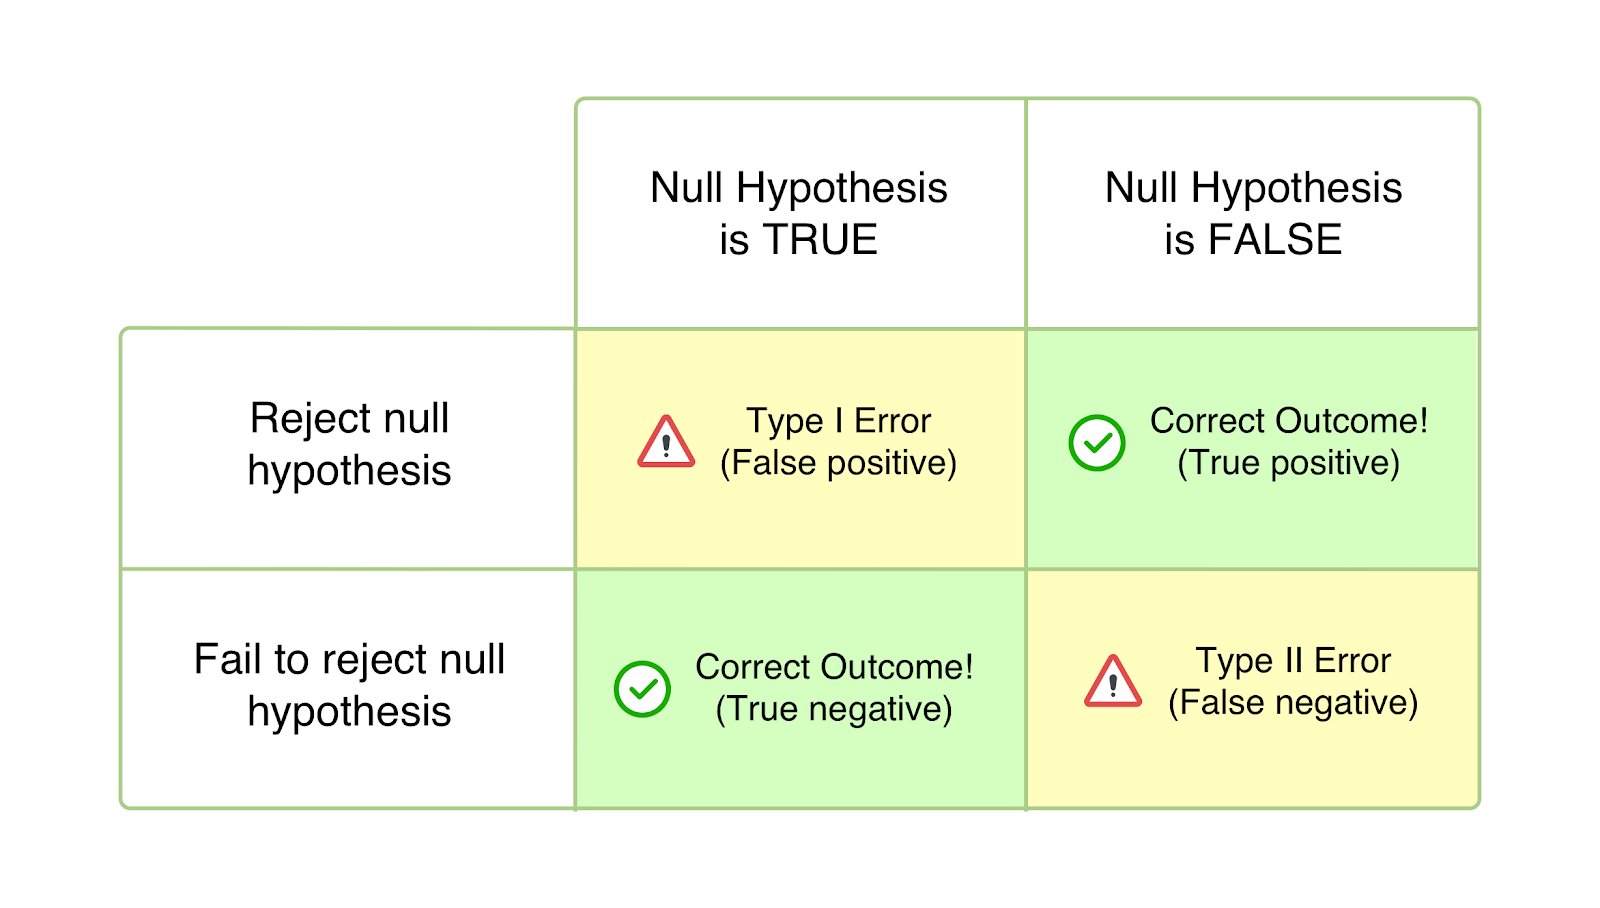
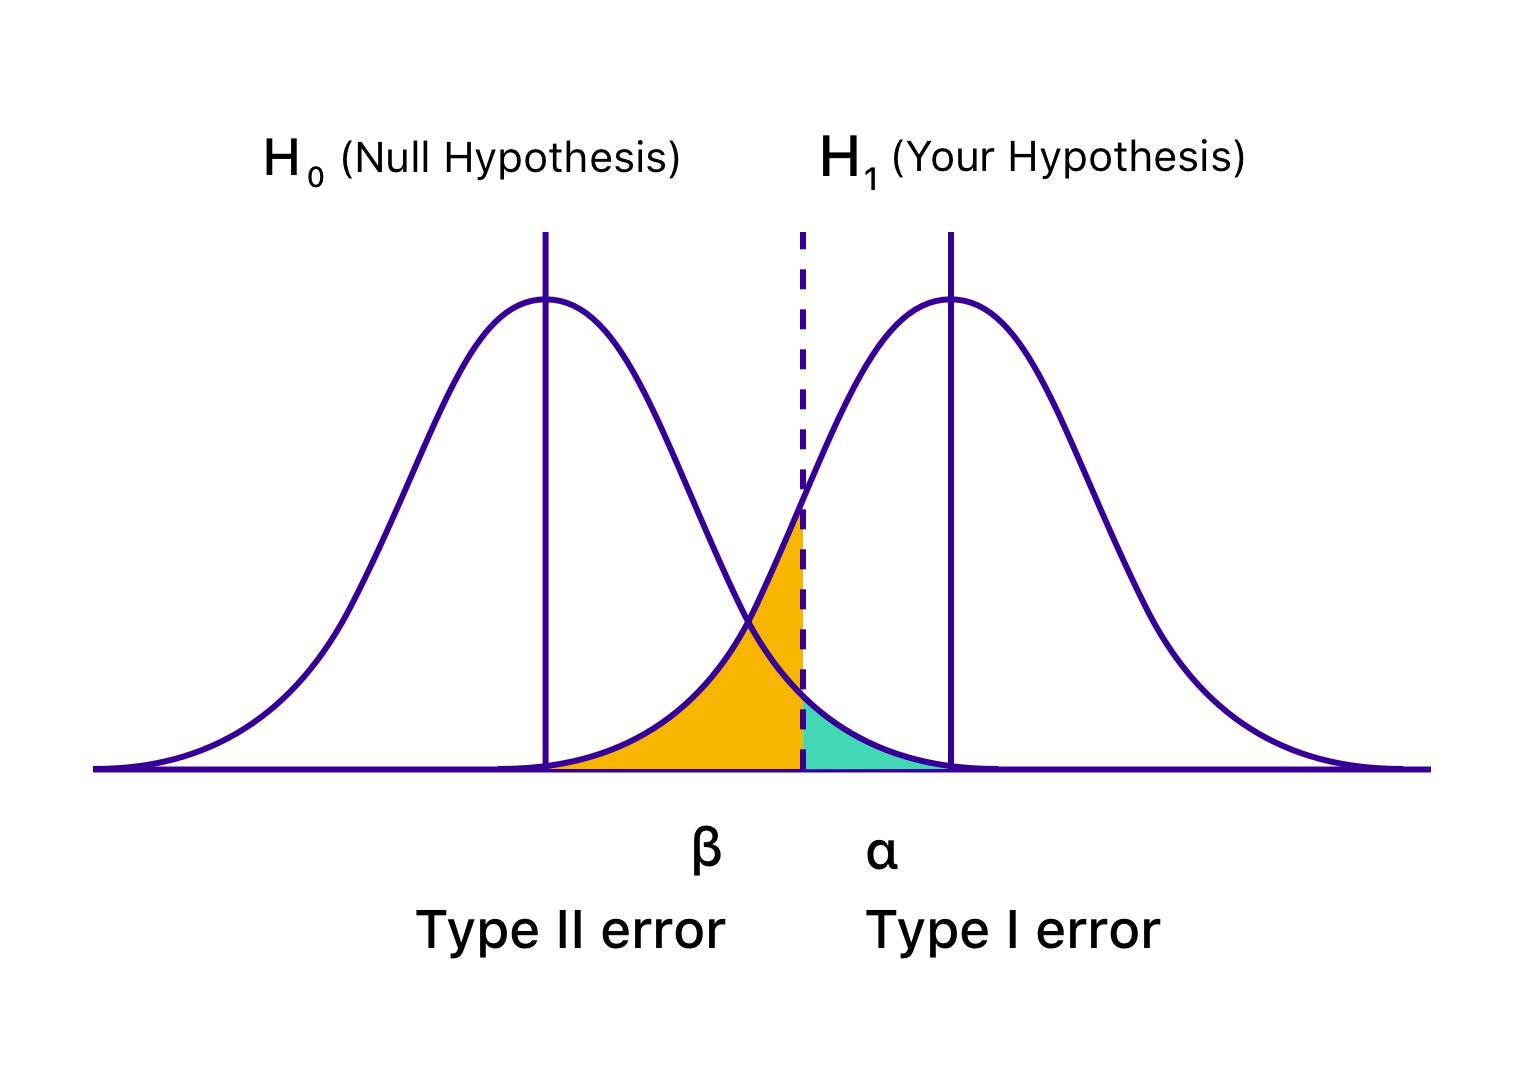
Type 1 errors – often assimilated with false positives – happen in hypothesis testing when the null hypothesis is true but rejected. The null hypothesis is a general statement or default position that there is no relationship between two measured phenomena.
Simply put, type 1 errors are “false positives” – they happen when the tester validates a statistically significant difference even though there isn’t one.Wingify’s Bayesian model-powered statistics engine, SmartStats, helps you reduce the probability of encountering a Type 1 error.
Type 1 errors have a probability of “α” correlated to the level of confidence that you set. A test with a 95% confidence level means that there is a 5% chance of getting a type 1 error.
Consequences of a Type 1 Error
Why do type 1 errors occur? Type 1 errors can happen due to bad luck (the 5% chance has played against you) or because you didn’t respect the test duration and sample size initially set for your experiment.
Consequently, a type 1 error will bring in a false positive. This means that you will wrongfully assume that your hypothesis testing has worked even though it hasn’t.
In real-life situations, this could potentially mean losing possible sales due to a faulty assumption caused by the test.
Related: Sample Size Calculator for A/B Testing
How to avoid type 1 errors
While it’s hard to avoid a Type 1 error entirely, there are things your brand can do to reduce the chances of them happening.
For instance, make sure you only mark your tests as conclusive once they’ve reached a high level of confidence. A 95% confidence level is ideal, but even after reaching this milestone – your test results could still be compromised by a Type 1 error.
Therefore, you also need to ensure that you run your tests for long enough to guarantee that a good sample size has been tested to increase the credibility of your test results.
Both sample size calculators and a Bayesian model-powered statistics engine can prove useful for avoiding type 1 errors.
A Real-Life Example of a Type 1 Error
Let’s say that you want to increase conversions on a banner displayed on your website. For that to work out, you’ve planned on adding an image to see if it increases conversions or not.
You start your A/B test by running a control version (A) against your variation (B) that contains the image. After 5 days, variation (B) outperforms the control version by a staggering 25% increase in conversions with an 85% level of confidence.
You stop the test and implement the image in your banner. However, after a month, you noticed that your month-to-month conversions have actually decreased.
That’s because you’ve encountered a type 1 error: your variation didn’t actually beat your control version in the long run.
In the Frequentist model, you must strictly adhere to the pre-set sample size and significance level to avoid ‘peeking’—which is a primary cause of Type I errors. In contrast, Bayesian models (like those used in modern experimentation platforms) often focus on ‘Potential Loss.’ This metric tells you the risk or ‘how much you might lose’ if you deploy a variation that isn’t actually better, providing a more business-centric way to manage Type I and Type II risks.
Read more here about Frequentist vs Bayesian Methods in A/B Testing →
Quick Reference Example: Type 1 Error
Type I (False Positive): Moving a CTA ‘above the fold’ and seeing a spike in clicks that disappears after the ‘novelty effect’ wears off. You’ve implemented a change that doesn’t actually provide long-term value
Want to avoid these types of errors during your digital experiments?
AB Tasty is an a/b testing tool embedded with AI and automation that allows you to quickly set up experiments, track insights via our dashboard, and determine which route will increase your revenue.
Understanding Type 2 Errors
In the same way that type 1 errors are commonly referred to as “false positives”, type 2 errors are referred to as “false negatives”.
Type 2 errors happen when you inaccurately assume that no winner has been declared between a control version and a variation although there actually is a winner.
In more statistically accurate terms, type 2 errors happen when the null hypothesis is false and you subsequently fail to reject it.
If the probability of making a type 1 error is determined by “α”, the probability of a type 2 error is “β”. Beta depends on the power of the test (i.e., the probability of not committing a type 2 error, which is equal to 1-β).
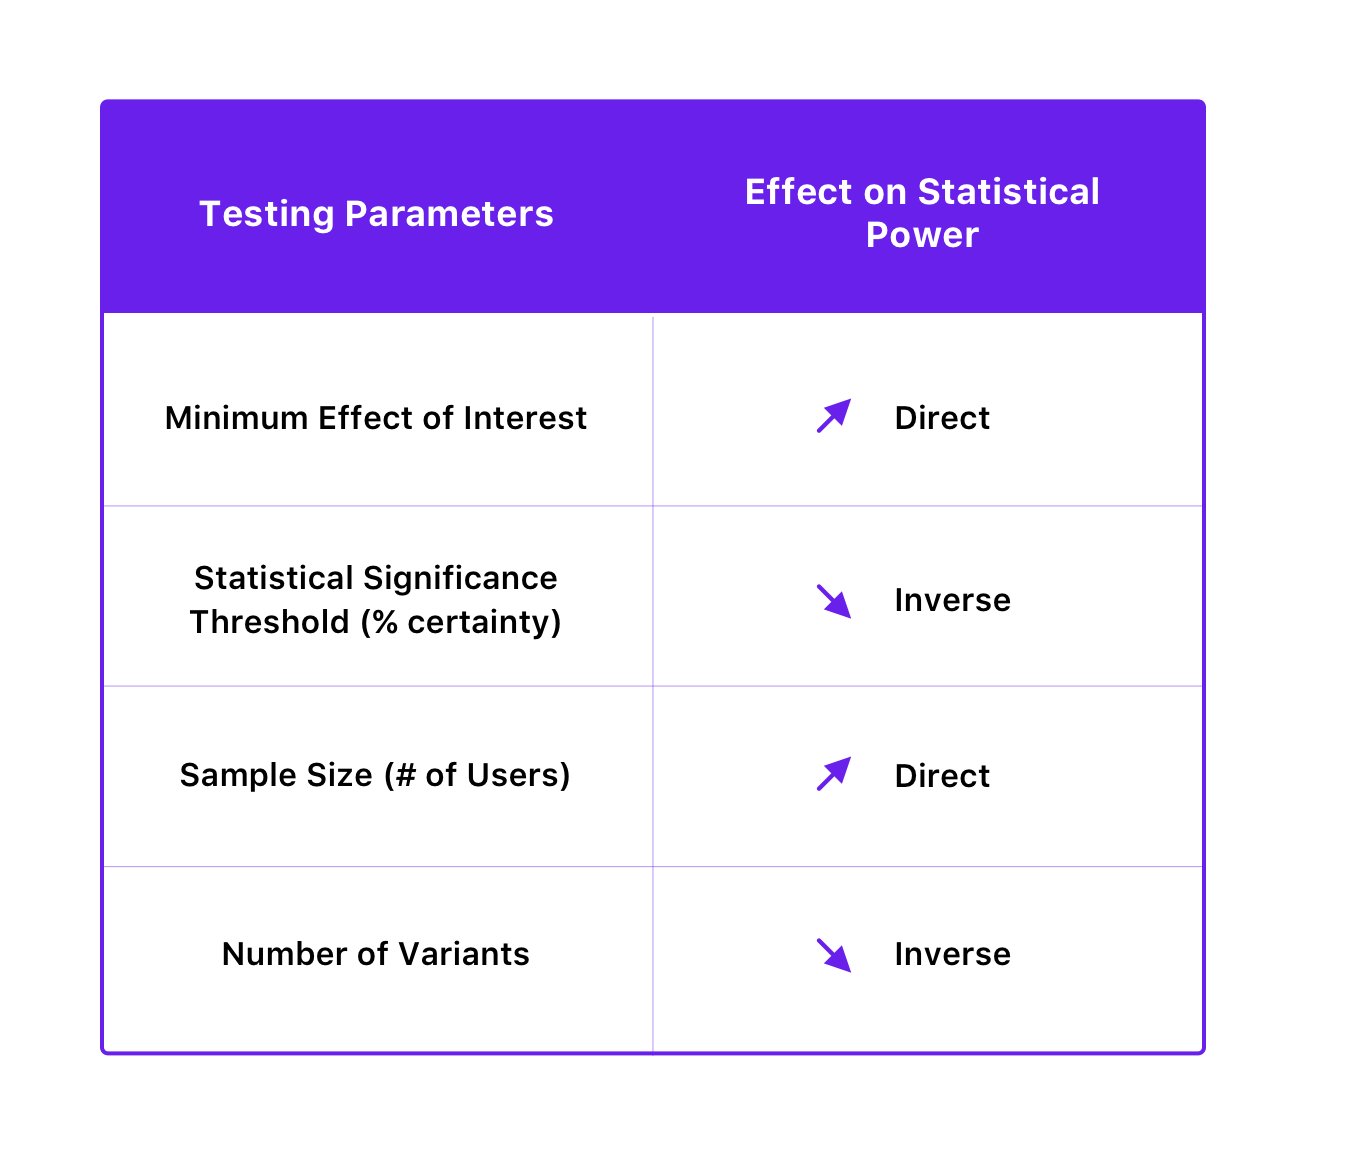
There are 3 parameters that can affect the power of a test:
- Your sample size (n)
- The significance level of your test (α)
- The “true” value of your tested parameter (read more here)
- The number of variations: The more versions you test against the control, the more you dilute your traffic, which can decrease the statistical power of each variation.
- Minimum Detectable Effect (MDE): The smaller the improvement you are trying to detect, the more power (and more traffic) you need to confirm it is real.
Consequences of a Type 2 Error
Similarly to type 1 errors, type 2 errors can lead to false assumptions and poor decision-making that can result in lost sales or decreased profits.
Moreover, getting a false negative (without realizing it) can discredit your conversion optimization efforts even though you could have proven your hypothesis. This can be a discouraging turn of events that could happen to any CRO expert and/or digital marketer.
How to avoid type 2 errors
You can avoid type 2 errors by improving the statistical power of your tests.
This can be done by increasing your sample size and decreasing the number of variants. What’s even more interesting is that improving the statistical power to reduce the probability of false negative can also be achieved by decreasing the statistical significance threshold.
However, this can increase the probability of Type 1 errors – and since the consequences of Type 1 errors are more severe than Type 2 errors – it’s best to not interfere with the statistical significance level for the sake of improving power.
A Real-Life Example of a Type 2 Error
Let’s say that you run an e-commerce store that sells cosmetic products for consumers. In an attempt to increase conversions, you have the idea to implement social proof messaging on your product pages, like NYX Professional Makeup.
Type 1 error vs Type 2 error – Which is worse?
Frankly, both type 1 and type 2 errors can be considered worse depending on a specific context. But while type 2 errors lead to missed opportunities to follow your hypotheYou launch an A/B test to see if the variation (B) could outperform your control version (A).
After a week, you do not notice any difference in conversions: both versions seem to convert at the same rate and you start questioning your assumption. Three days later, you stop the test and keep your product page as it is.
At this point, you assume that adding social proof messaging to your store didn’t have any effect on conversions.
Two weeks later, you hear that a competitor had added social proof messages at the same time and observed tangible gains in conversions. You decide to re-run the test for a month in order to get more statistically relevant results based on an increased level of confidence (say 95%).
After a month, surprise! You discover positive gains in conversions for the variation (B). Adding social proof messages under the purchase buttons on your product pages has indeed brought your company more sales than the control version.
That’s right – your first test encountered a type 2 error!
Quick Reference Example: Type 2 Error
Type II (False Negative): Adding security badges to a payment page. Initial data shows no change because the sample size was too small, so you discard the idea. In reality, customers do feel more secure, and a longer test would have proven a 5% lift in revenue.
Which is Worse: Type I or Type II Errors?
Both type 1 and type 2 errors can have significant repercussions depending on the context.
Here’s a breakdown of the downsides of both type one and type two errors:
- Type 1 is generally considered worse: It results in implementing ineffective changes, wasting resources, and potentially damaging the user experience.
- Type 2 is often seen as “less dangerous”: While it leads to missed opportunities, you simply continue using a version that has already shown some level of success over time
When to Define Your Error Thresholds
“Note on Methodology: It is important to remember that Type I and Type II error rates (Alpha and Beta) are ‘facilitators’ rather than ‘outputs.’ You decide on these thresholds before you start your test to determine the required sample size and duration. They are not metrics that are calculated from the data once the test is over.
Why are Type I and Type II Errors Important?
Type one and type two errors are errors that we may encounter on a daily basis. It’s important to understand these errors and the impact that they can have on your daily life.
With type 1 errors you are making an incorrect assumption and can lose time and resources. Type 2 errors can result in a missed opportunity to change, enhance, and innovate a project.
To avoid these errors, it’s important to pay close attention to the sample size and the significance level in each experiment.
Rely on Wingify’s sophisticated reporting and accurate results
Since aiming for absolute certainty is extremely difficult with statistics, you cannot eliminate the possibility of your test results not being skewed due to an error. However, by choosing a robust tool like Wingify, you can lower your chances of making errors or reduce the risk associated with these errors to an acceptable level. To understand more about how exactly Wingify can keep you from falling prey to such errors, try out Wingify’s free trial or request a demo by one of our optimization experts.
Frequently Asked Questions
Type 1 error is the probability of rejecting the null hypothesis when it is true, usually determined by the chosen significance level. Type 2 error is the probability of failing to reject the null hypothesis when it is false and is influenced by factors like statistical power and effect size. These errors facilitate the overall calculations of test results but are not individually calculated in hypothesis testing.
To reduce Type 1 errors, which mean falsely rejecting the null hypothesis, it is crucial to choose an appropriate significance level and stick to it. Being cautious when interpreting results and considering the practical significance of findings can also help mitigate Type 1 errors. To decrease Type 2 error risk, which means you have failed to reject the null hypothesis when it is false, increasing the sample size can enhance the statistical significance. Further, designing a test (backed by a strong hypothesis) that can actually identify meaningful differences can decrease Type 2 errors.
Type 1 error occurs when you reject the null hypothesis by mistake when it is actually true. In this case of hypothesis testing, you might conclude a significance between the control and variation when there is not one. Type 2 error occurs when you fail to reject the null hypothesis when it is false. This means you overlook a considerable difference that exists. By examining the statistical significance, confidence intervals, and sample size, you can identify if these errors have occurred in your test result.
Categories:

Shubhi is a result-oriented content marketing specialist with an undying passion for storytelling and astute attention to detail. When not at work, you'll find her planning her next vacation, putting her amateur culinary skills to use, or binging on a sitcom.