Your product page A/B test has been running for two weeks, and the result is flat. The conversion rate tells you what happened, but not why. Then, a glowing red hotspot on the heatmap shows visitors furiously clicking on a checkmark graphic that isn’t actually a link, while your new “Buy Now” button sits ignored in a cold, blue zone.
That’s the gap heatmaps fill in A/B testing. They add behavioral evidence to test results, helping you understand why an experiment performed the way it did. In fact, they can reveal friction worth experimenting on by showing how users interact with page elements.
So, the question isn’t simply “Does the A/B testing tool have heatmaps?” It’s “How well does it connect heatmaps with experimentation?”
We compared 7 top A/B testing tools with heatmaps for 2026 to find out.
Benefits of using heatmaps in A/B testing tools
Statistical reports reveal what happened, but they rarely explain why. Here’s what heatmaps add to an experimentation program that metrics alone can’t.
Faster, more specific hypotheses: Scroll maps and click maps show exactly where users disengage. For example, if 60% of visitors never scroll past the hero section on a pricing page, you’ve uncovered a clear hypothesis to test. Simply knowing that “conversion could be better” isn’t enough to design a meaningful experiment.
Explain why a variation won or lost, not just that it did: Filtering heatmap and click data by test variation shows whether users engaged with the changed element as intended, or whether the lift came from something else entirely.
Reveal unintended user behavior before rolling out a winner: A variation may increase conversions while encouraging interactions you never intended: misread labels, accidental clicks, or confusing navigation. Reviewing heatmaps alongside test results helps identify these patterns before the winning variation becomes your new default.
Surface behavior differences across audience segments: Heatmap filters let teams track user behavior by device, traffic source, visitor type, user attributes, or other segments, often revealing patterns hidden in aggregate results. A test may appear neutral overall while one segment clearly benefits from the variation.
Flag broken or misleading interactions: Rage clicks and dead clicks reveal friction that conversion reports can’t show, such as visitors repeatedly clicking an icon, image, or label they expect to be interactive. Addressing these friction points before launching new experiments leads to cleaner test results and more reliable conclusions.
Heatmaps generate the hypothesis. A/B testing validates it. Let’s understand how these work together in practice through a real case study of Media Contour’s optimization of Life Pro Fitness’s product pages.
Discovery: Identify behavioral friction
Media Contour combined heatmaps, click maps, session recordings, heuristic analysis, and funnel drop-off analysis and discovered a key friction point: shoppers had to search for important product information and CTAs before making a purchase.
Experimentation: Turn insights into test hypotheses
The friction point identified formed the hypothesis for Media Contour. The team tested a redesigned product page that moved product images, key product information, and the primary CTAs (Add-to-cart and Buy now) above the fold, making them visible without scrolling.
Validation: Confirm the behavioral impact
For Media Contour, comparing post-test heatmaps with the control revealed higher engagement on the redesigned product page. The resulting 15.63% increase in conversions confirmed that the variation successfully resolved the behavioral friction uncovered during the discovery phase.
Yes, linked directly from heatmap hotspots; AI summaries
Custom pricing; 30-day trial
Zoho PageSense
Click, scroll, attention, dynamic and cross-device heatmaps; variation-level analysis
Yes
Free plan; paid from $12/month annually
Convert Experiences
Click, scroll, and tap heatmaps across control and variations
Yes
From $299/month annually; 15-day trial
PostHog
Clickmaps, scrollmaps, mouse movement, rage and dead clicks
Yes
Free monthly tier; usage-based thereafter
Amplitude
Click, scroll and selector maps
Yes, with AI summaries
Free up to 2M events/month; usage-based thereafter
Inspectlet
Dynamic, eye-tracking and click heatmaps; scroll depth; element-level analysis
Yes
Free plan; paid from $33/month annually
Crazy Egg
Click, scroll, confetti, list, and overlay heatmaps
Yes
From $20/month; 30-day trial
1. Wingify
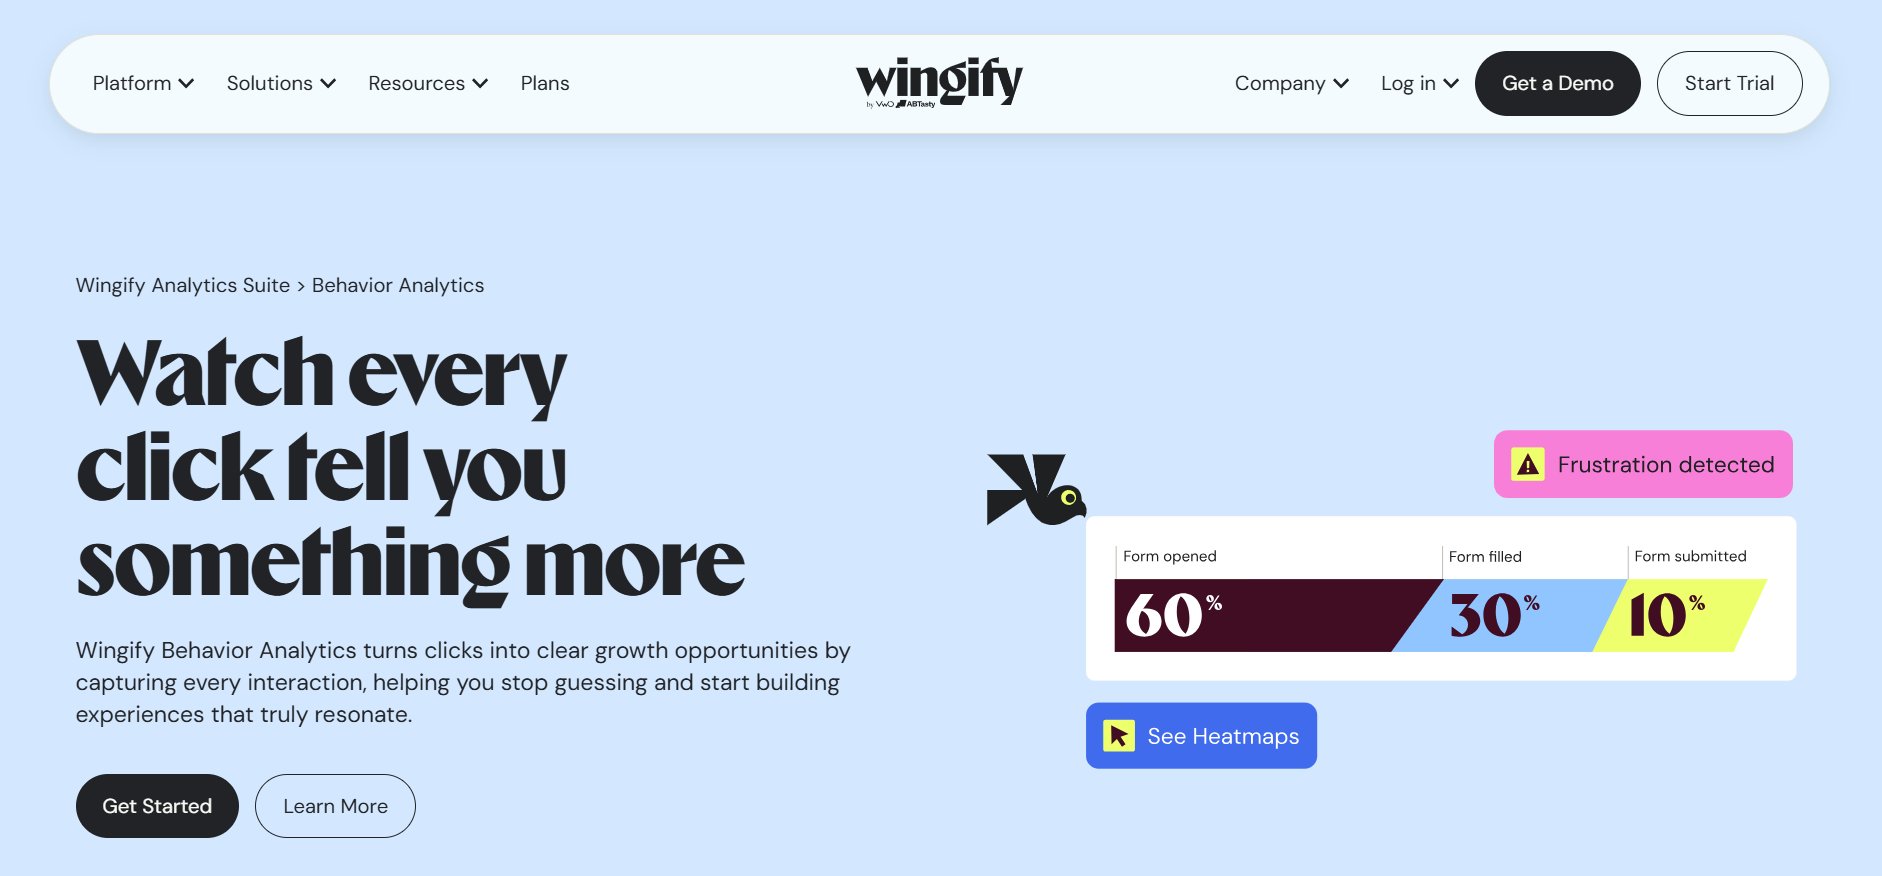
Wingify is an Agentic Experience Optimization Platform that connects its Analytics Suite with Experimentation and Personalization to deliver more relevant user experiences. Within the Analytics Suite, Behavior Analytics helps teams understand where visitors click, scroll, hesitate, or drop off through heatmaps, session recordings, and form analytics. Teams can then turn these behavioral insights into hypotheses and test them using Wingify Experimentation, bringing analytics, experimentation, and personalization and other capabilities together in one platform.
Best features
Behavior Analytics: Use heatmaps and scrollmaps to visualize user behavior, while session recordings and form analytics help investigate where visitors hesitate, encounter friction, or drop off.
Behavioral analysis within experiments: Analyze heatmaps for the control and variations to understand how visitor behavior changes alongside experiment performance.
Journey Analytics: Analyze user journeys and funnels to identify drop-offs and understand where visitors struggle to progress toward conversion.
User Feedback: Capture visitor feedback to understand their needs, expectations, and reasons behind their behavior.
Wingz intelligence layer:Wingz, Wingify’s intelligence layer, brings behavioral signals from heatmaps and session recordings together to surface friction patterns and turn them into test-ready hypotheses, reducing the manual work between discovery and experimentation.
Pro Tip!
Use advanced segmentation to target the right users. Filter visitors by technology, geography, user type, or specific behaviors such as rage clicks and form abandonment to understand how different segments interact with your experience and identify what’s costing you conversions.
Other key features:
No-code visual editor
Web and cross-platform experimentation
Feature experimentation and controlled releases
A/B, multivariate, split URL, and multi-page experimentation
Audience targeting and segmentation
MCP server integration
Mutual exclusion groups
Traffic allocation and scheduling
Custom goals and conversion tracking
Enterprise security and governance
Free trial period
30-day all-inclusive trial is available
Pricing
Custom plans are available on request
Pros and Cons
Pros:
Detailed reporting and visitor behavior insights, paired with observations, help teams document findings and identify optimization opportunities for the next tests.
Cons:
Advanced features and complex experiment configurations can have a learning curve, particularly for new users.
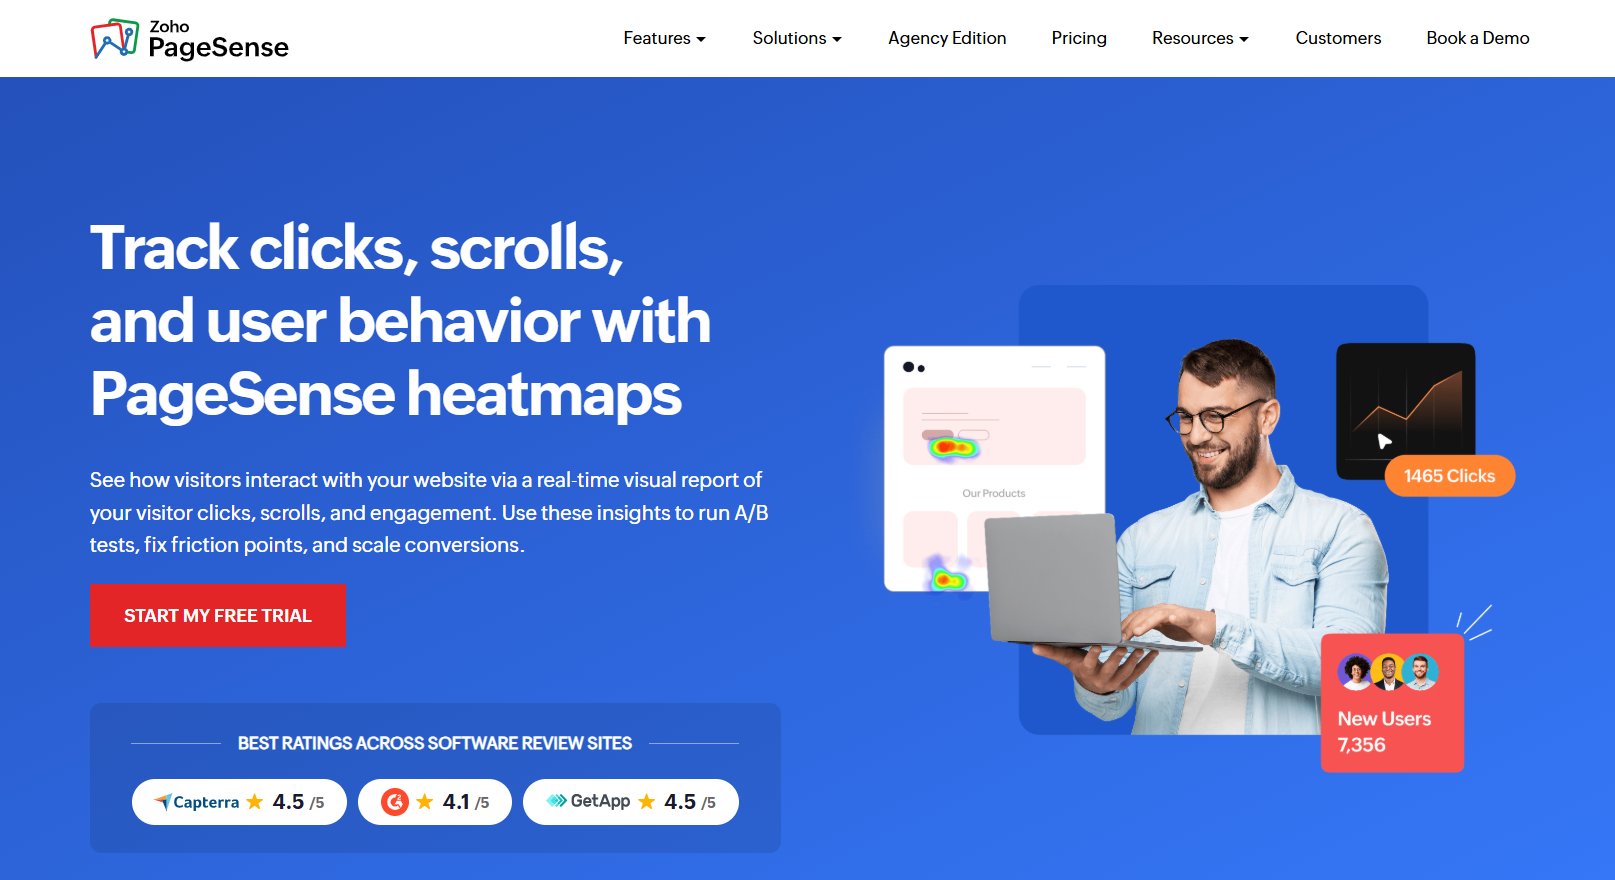
Zoho PageSense is a conversion optimization platform that brings together A/B testing, live real-time heatmaps, and visitor behavior analysis in a single interface. It’s a good fit for small to mid-sized businesses that want an affordable, integrated website optimization solution.
Best features
A/B, split URL, server-side testing
Heatmaps by A/B test variation
Click, scroll, and attention maps
Dynamic heatmaps for pop-ups, dropdowns, carousels, sliders, and tabs
Cross-device heatmaps
Session recordings
Funnel analysis
Form analytics
Advanced filtering
Smart audience segmentation
Free trial period
15 days of full access to all features
Pricing
Free: Forever free plan for up to 5,000 MTUs
Paid: Starts from $12/month, billed annually
Pros and Cons
Pros:
Makes it easy to analyze website engagement and validate landing page improvements through A/B testing.
Cons:
The layered interface can make navigation challenging, while customer support can be slow to respond.
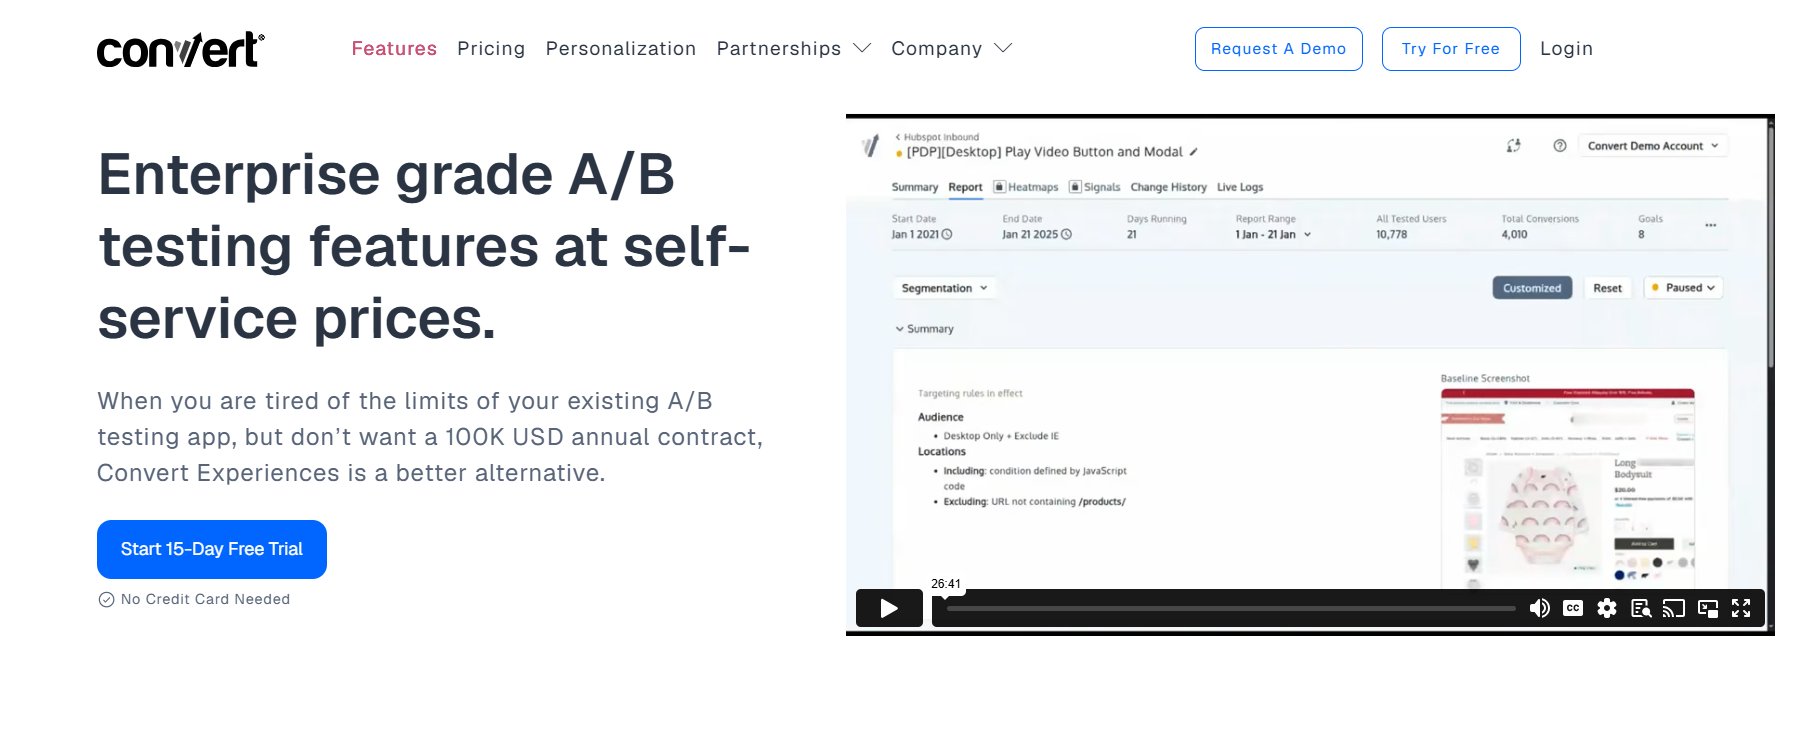
Convert Experiences is built for organizations that take experimentation and data privacy equally seriously. It combines advanced A/B testing with integrated heatmaps, enabling teams to compare clicks, taps, and scroll behavior across both the control and test variations to better understand what drives winning experiments.
Best features
A/B, split URL, and multi-page testing
Multivariate testing
Full -stack experimentation
Visual and 5 code editors
40+ audience targeting filters
Behavior-based targeting
Native session recordings with Convert Signals
Built-in click, scroll, and tap heatmaps
Statistical methods: Frequentist & Bayesian stats engine, Sequential testing, and Sample Ratio Mismatch (SRM) detection
MCP server
Free trial period
15-day access to all Premium plan features
Pricing
Paid: Growth plan starts at $299/month, billed annually
Pros and Cons
Pros:
Competitive feature-to-price value, backed by responsive customer support and simple snippet-based implementation.
Cons:
Limited flexibility in goal-setting and tracking can restrict execution of more complex experiments and advanced analysis.
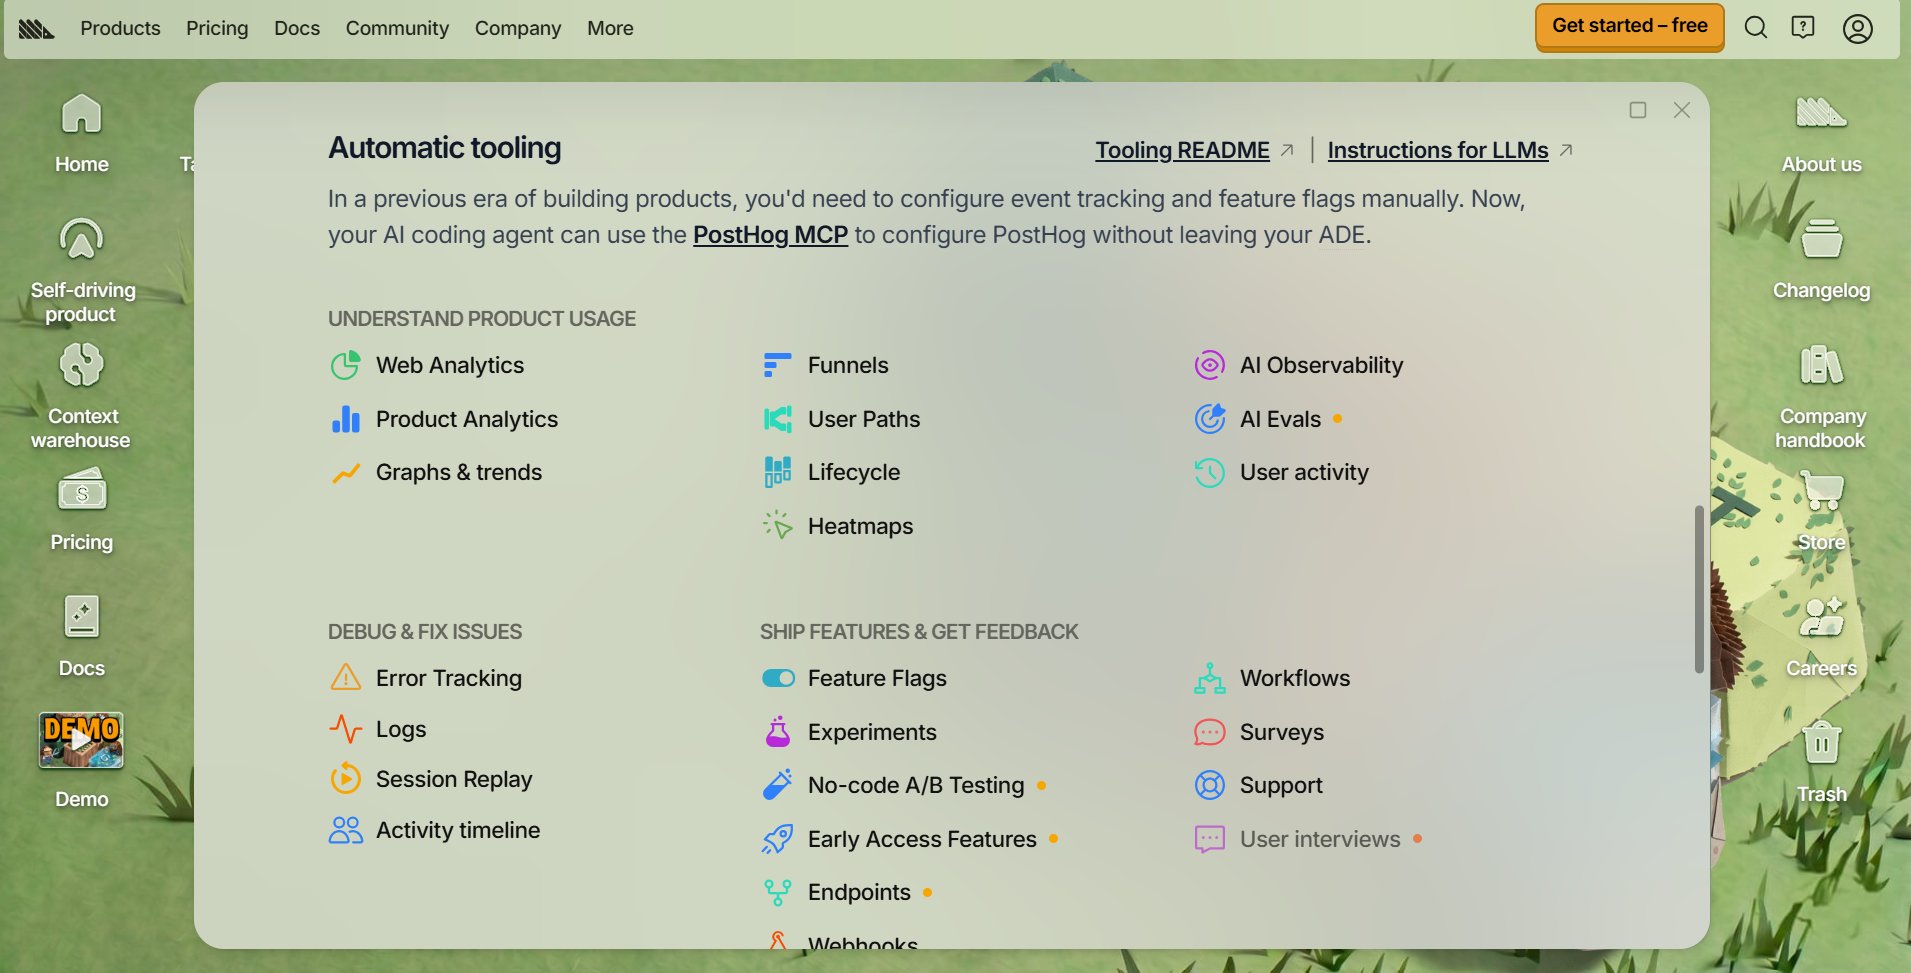
PostHog’s open-source experimentation platform is built for product teams that want to understand user journeys and how they interact with new features before rolling them out widely. It brings experimentation, heatmaps, session replays, and product analytics into a single workflow, making it well-suited for engineering-led organizations.
Best features
No-code A/B testing
Feature flags
Mouse movements, clicks, dead clicks, and rage clicks
Scrollmaps
Clickmaps
Wildcard URL matching
Session replay
Funnels
Product and web analytics
Free trial period
No free trial available
Pricing
Free: Monthly free tier on all plans
Paid: Usage-based pricing after exhaustion of the monthly free tier
Pros and Cons
Pros:
Straightforward implementation and automatic interaction tracking make it easy for teams to adopt and quickly start analyzing user behavior.
Cons:
Advanced features come with an initial learning curve and may take some time to master.
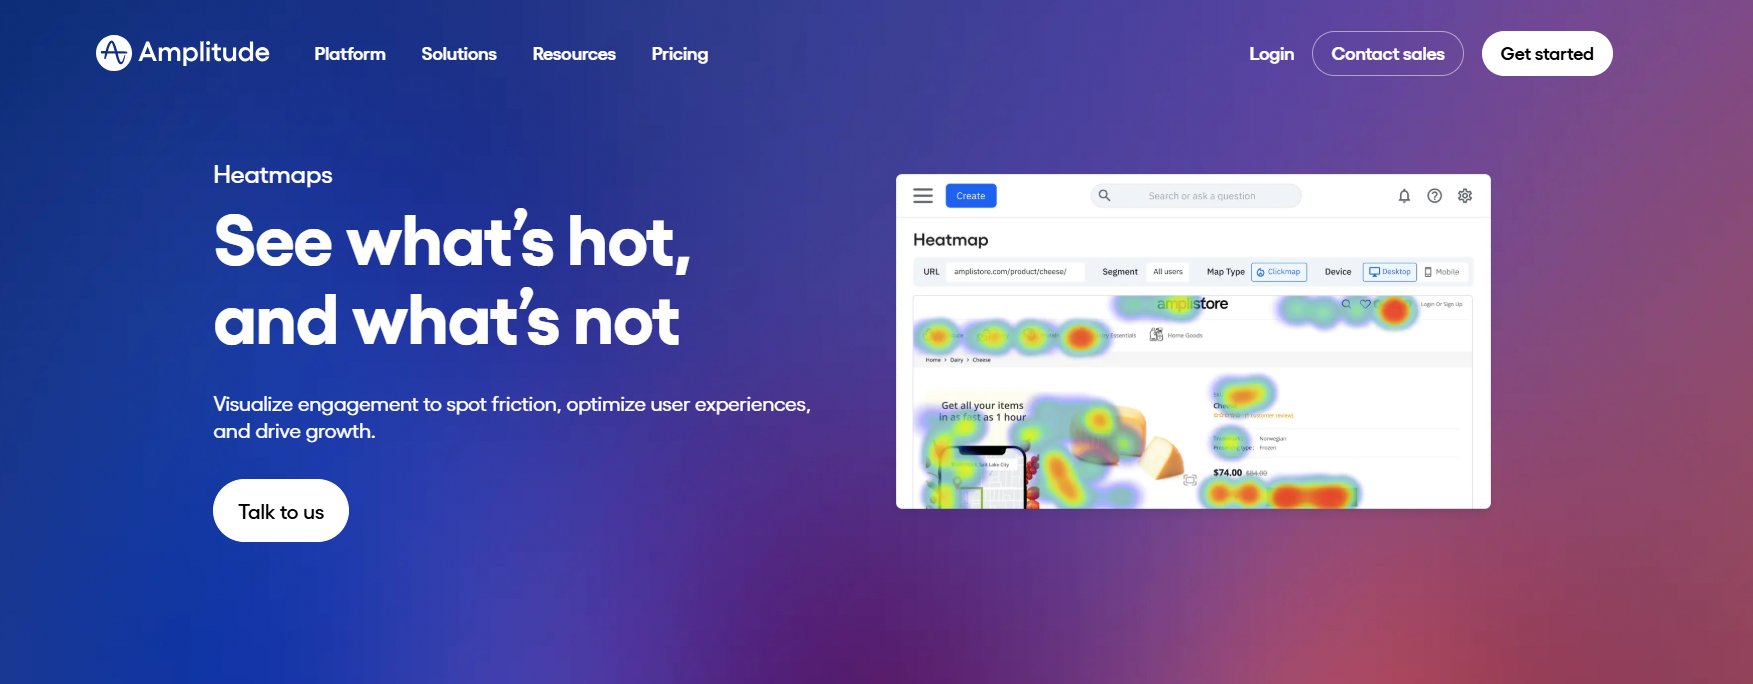
Amplitude combines digital analytics with web experimentation, using heatmaps to visualize clicks, scrolls, and engagement hotspots across websites and web apps. It’s best suited for organizations that want experimentation guided by customer-journey insights rather than standalone test metrics.
Best features
A/B/n testing
Feature experimentation
No-code visual editor
Click maps, scroll maps, selector maps
Session replay and AI-based summaries
Funnels
Segmentation
Sequential testing, CUPED, multi-armed bandits
Page & browser-level targeting
Product and web analytics
Free trial period
No free trial available
Pricing
Free plan: 2M events/month; access to most of the features
Paid: Event-based pricing after the first 2M events
Pros and Cons
Pros:
AI-driven insights automatically surface friction points across the customer journey, reducing the manual effort needed to analyze funnels and identify optimization opportunities.
Cons:
Session replay performance can decline for longer sessions, with limited sharing and annotation capabilities.
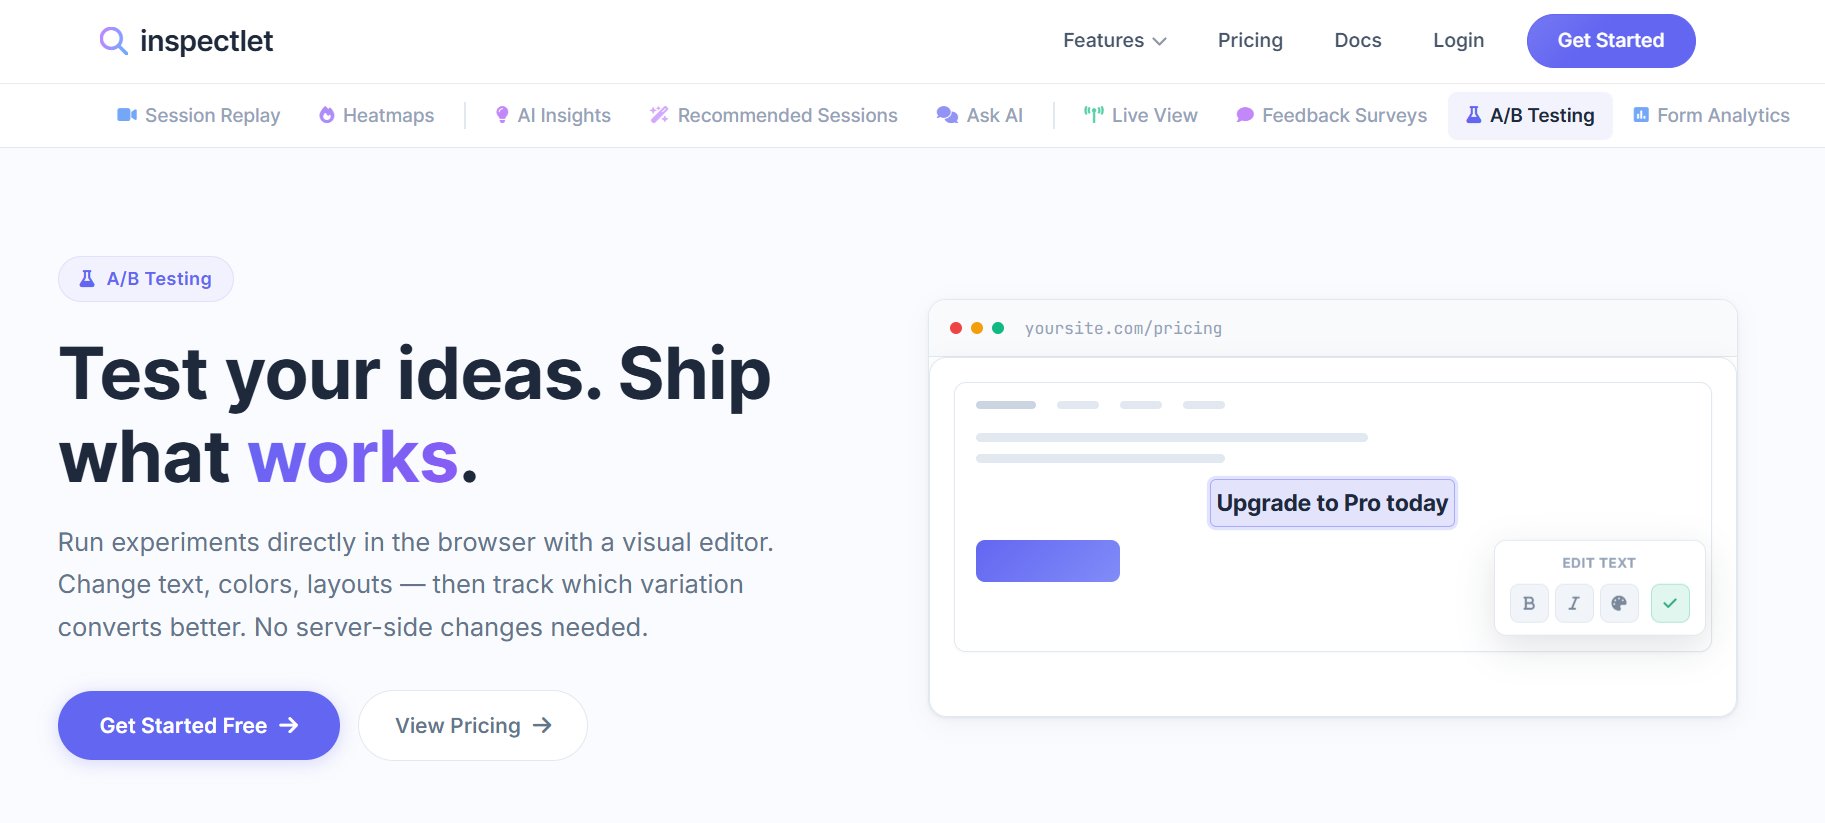
Inspectlet extends A/B testing with dynamic heatmaps that visualize how visitors interact with the control and each test variation. By revealing click, scroll, and engagement patterns, it helps teams understand why an experiment succeeded or failed, not just which version won.
Best features
A/B testing
Point-and-click visual editor
Eye-tracking heatmaps
Click heatmaps
Element click map
Scroll depth
Session replay
AI insights
Traffic source segmentation
Element-level click analysis
Free trial period
No free trial available
Pricing
Free plan: 5,000 session replays, 500K sessions per month across up to 3 websites
Paid: Starts at $33/month, billed annually
Pros and Cons
Pros:
Intuitive interface and detailed session recordings make it easy to review individual visitor journeys and identify usability issues.
Cons:
Limited to client-side A/B testing, making it less suitable for teams that need server-side or feature experimentation.
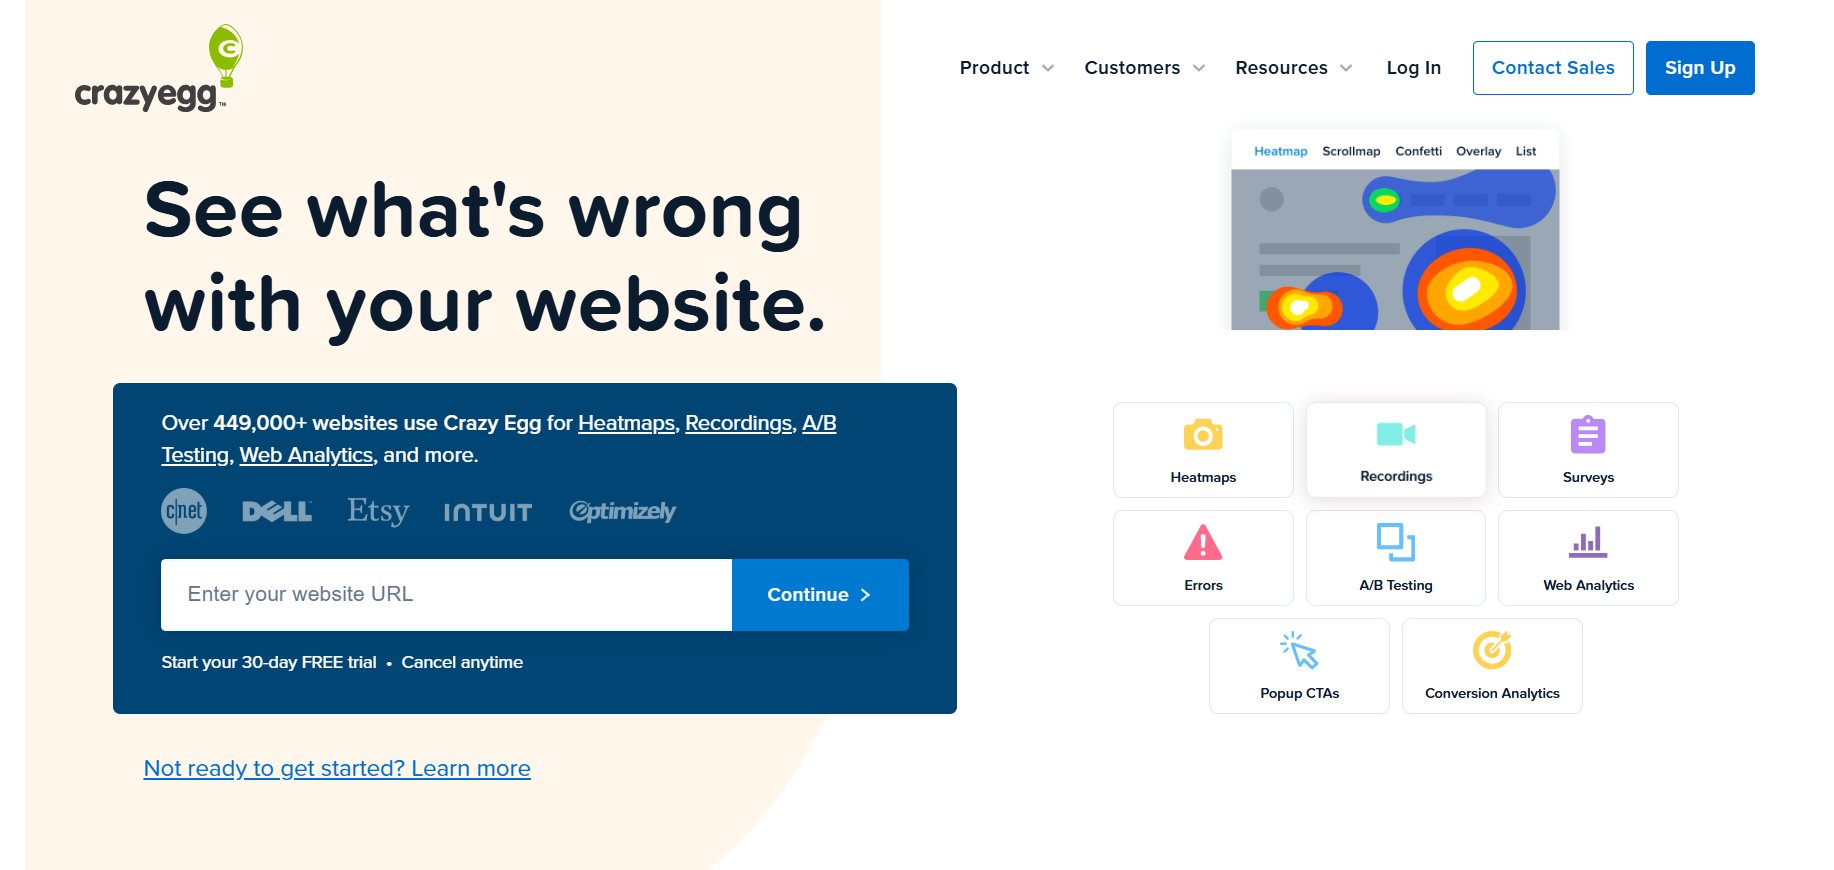
Crazy Egg focuses on visual website optimization. Pairing heatmaps with A/B testing helps teams uncover visitor friction, prioritize improvements, and measure the impact of every design change. It’s ideal for marketers looking for a fast-to-set-up, easy-to-use platform for conversion rate optimization (CRO).
Best features
A/B testing with a visual page editor
Click, scroll, confetti, list, and overlay heatmaps
Session recordings
20+ audience targeting filters
Web analytics
AI analysis
Segmentation
Free trial period
30-day for all plans
Pricing
Paid: Plans start from $29/month, billed annually.
Pros and Cons
Pros:
Makes it practical to run experiments more frequently while capturing deeper behavioral data around each test.
Cons:
Session recording limits can feel restrictive for websites tracking visitor behavior across many pages.
A/B testing platforms with heatmaps and session recording
While a heatmap gives you an aggregated view of user interactions, such as clusters of clicks on a broken link, a session recording works like a digital DVR for your website. It lets you pause, rewind, and fast-forward through an individual visitor’s session to see the exact moment they got frustrated.
Here’s what that combination adds to a CRO program that a heatmap or test result alone can’t:
Spotting rage clicks and confusion: Heatmaps may reveal repeated clicks on a non-interactive element, but session recordings show the sequence of actions leading up to that frustration, helping you decide what to test next.
Understanding A/B test results: If a variation underperforms, session recordings reveal how users interacted with the new experience, whether they struggled to find key information, abandoned a form midway, or encountered an unexpected usability issue.
Session recordings reveal micro-frustrations that heatmaps alone can’t show. Hovering without clicking, rage clicks, or repeated back-and-forth behavior are all signs of friction. For instance, in one case, users kept clicking on product thumbnails expecting a zoom function. That insight led to the introduction of a zoom feature and image carousel, which significantly increased product engagement.
Jin Ma, Director of Experience, Media, Dentsu (Source:Expert Interviews)
Heatmaps and session recordings reveal how visitors interact with your website, but analyzing them at scale can make it difficult to spot the most crucial patterns. AI can speed up this process by summarizing user behavior, identifying friction points such as rage clicks and drop-offs, and surfacing insights that help teams form stronger testing hypotheses. Want to see how AI can fast-track the journey from insight to action? Watch the webinar on using Wingz for heatmaps and session recordings.
Conclusion: Choose an A/B testing tool that shows the “why”
Heatmaps become far more useful for experimentation when they inform both ends of the process: uncovering user behavior and shaping hypotheses before a test, then helping explain variation performance afterward.
To get more from experimentation, choose a platform that facilitates this connection and automates the process.
With Wingify, you can connect Behavior Analytics, Experimentation, and Personalization, powered by Wingz, to turn user behavior into testable ideas and more informed optimization decisions. This connected approach reduces manual analysis, saves time and effort, and helps teams make more informed optimization decisions. Request a demo now!
FAQs
How do heatmaps improve A/B testing results?
Heatmaps add behavioral context to A/B test data. They help teams identify friction before testing and compare how visitors interact with the control and variations afterward, making it easier to understand why a variation won or lost and what to test next.
Which are the best A/B testing tools with heatmaps?
All the A/B testing heatmap tools discussed above include heatmap capabilities alongside experimentation. The right choice depends on the depth of heatmap analysis, integration with test results, experimentation capabilities, behavioral analytics features, technical requirements, and budget.
Hi, I’m Pratyusha Guha, manager - content marketing at VWO. For the past 6 years, I’ve written B2B content for various brands, but my journey into the world of experimentation began with writing about eCommerce optimization. Since then, I’ve dived deep into A/B testing and conversion rate optimization, translating complex concepts into content that’s clear, actionable, and human. At VWO, I now write extensively about building a culture of experimentation, using data to drive UX decisions, and optimizing digital experiences across industries like SaaS, travel, and e-learning.
You might also love to read these
12 Min Read
Feature Flag Management in Enterprise Experimentation Platforms: Complete Guide
6 Min Read
Turn Insights Into Action: How Wingz AI Closes the Loop