
When companies start tracking their Net Promoter Score (NPS), one question comes up almost immediately:
Is our NPS actually good?
The honest answer is that there is no one-size-fits-all number.
Typically, judging whether or not an NPS score is good is done by:
- Comparing the current NPS to previous scores to see how much it has improved.
- Comparing the average NPS score against competitors to see where you stand in your specific market.
Understanding both perspectives is essential to interpreting your Net Promoter Score correctly and using it to drive meaningful improvements.

What is a good NPS score?
A good Net Promoter Score generally indicates that you have more promoters than detractors.
But what’s considered “good” varies by your growth stage, type of industry, competitive landscape, and customer expectations.
According to Bain & Company, which created the Net Promoter System, NPS scores are classified as follows:
- Above 0 = good
- Above 20 = favorable
- Above 50 = excellent
- Above 80 = world-class
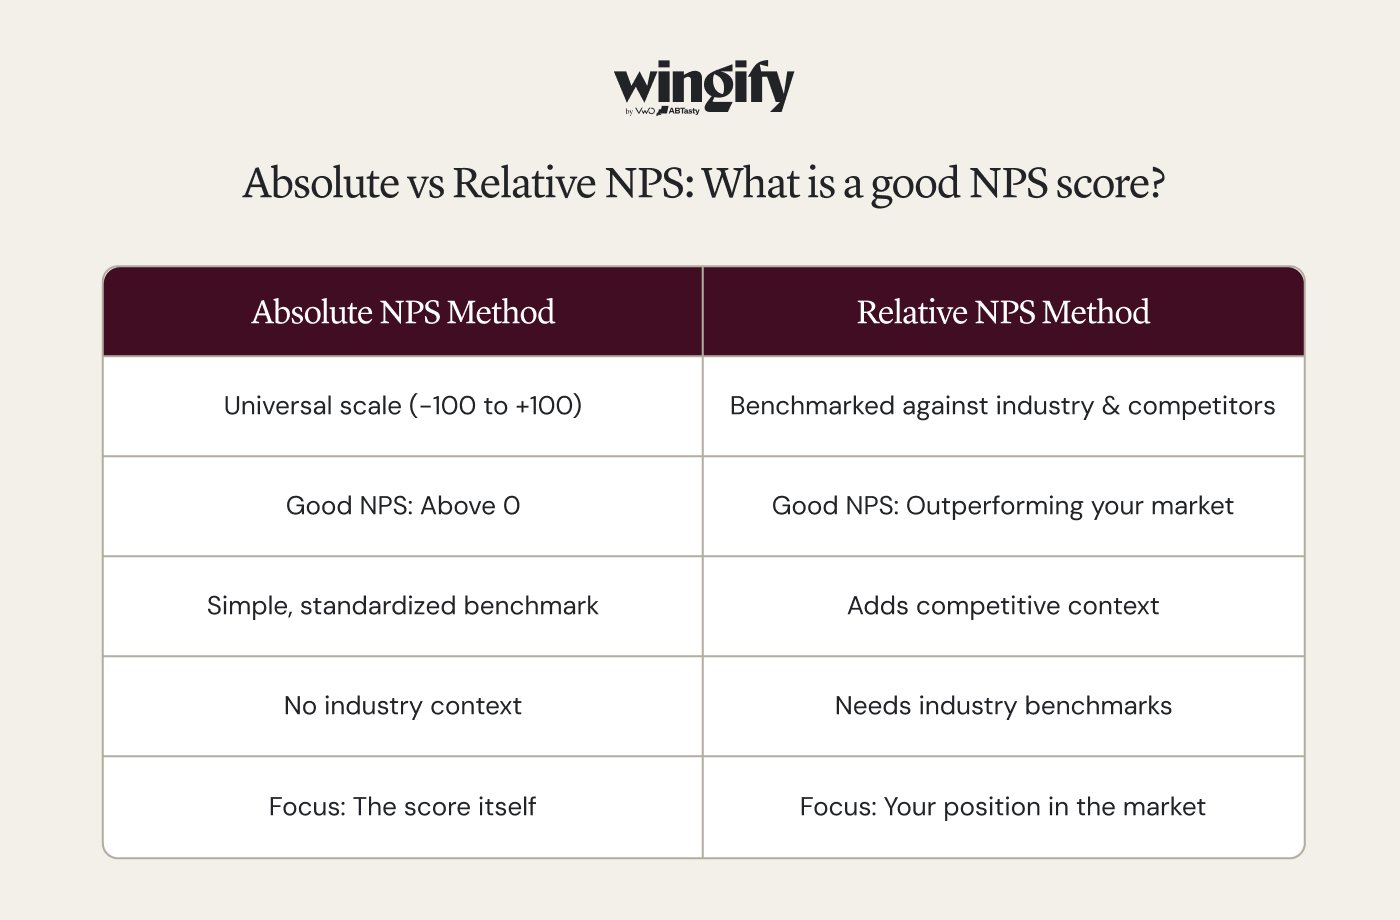
Absolute NPS method: What is a good NPS?
The absolute NPS method evaluates the score against universal benchmarks without comparing it to competitors or industry averages.
The typical NPS score in this method ranges between -100 and +100. Any score above 0 is considered to be a good NPS score, as it indicates you have more promoters than detractors. The absolute NPS is ranked as follows:
- NPS < 0: It falls under the poor category, meaning there are more detractors than promoters.
- 0 to 20: This is a good score and shows your customer experience is working, but there’s room to improve.
- 20 to 50: A great NPS score shows strong advocacy and consistent customer satisfaction.
- 50 to 80: An excellent NPS score, which means existing customers love your product and actively recommend it.
- 80+: A world-class NPS score. This indicates you have exceptionally loyal customers, often seen in top brands.
Although the absolute method is effective, it does not account for the significant differences in customer expectations across industries.
This is why most teams rely on the relative NPS method, which benchmarks your performance against competitors.
Relative NPS method: What is a good NPS?
While the absolute method gives you a clean, universal scale, the relative NPS method gives you context, and context often matters more than the number itself.
Under the relative NPS method, a good NPS score is defined by how you perform relative to your competitors or the industry average, not by an isolated score.
For example, a score of 30 might be fantastic in an industry where the average net promoter score is 10, but weak in a category where leading brands sit at 60+ NPS.
Here’s how to interpret NPS using the relative method:
- Above your industry average: Good NPS
- Top quartile of your industry: Great NPS
- Top 10% of your industry: Excellent NPS
- Below industry NPS benchmarks: Needs attention, even if the absolute score seems positive
Using the relative method, a good NPS becomes less about chasing a specific number and more about outperforming the market you compete in.
Net Promoter Score benchmarks by industry: What to aim for
Here is the United States NPS average by industry (rolling four quarters, Q1 2025 – Q4 2025):
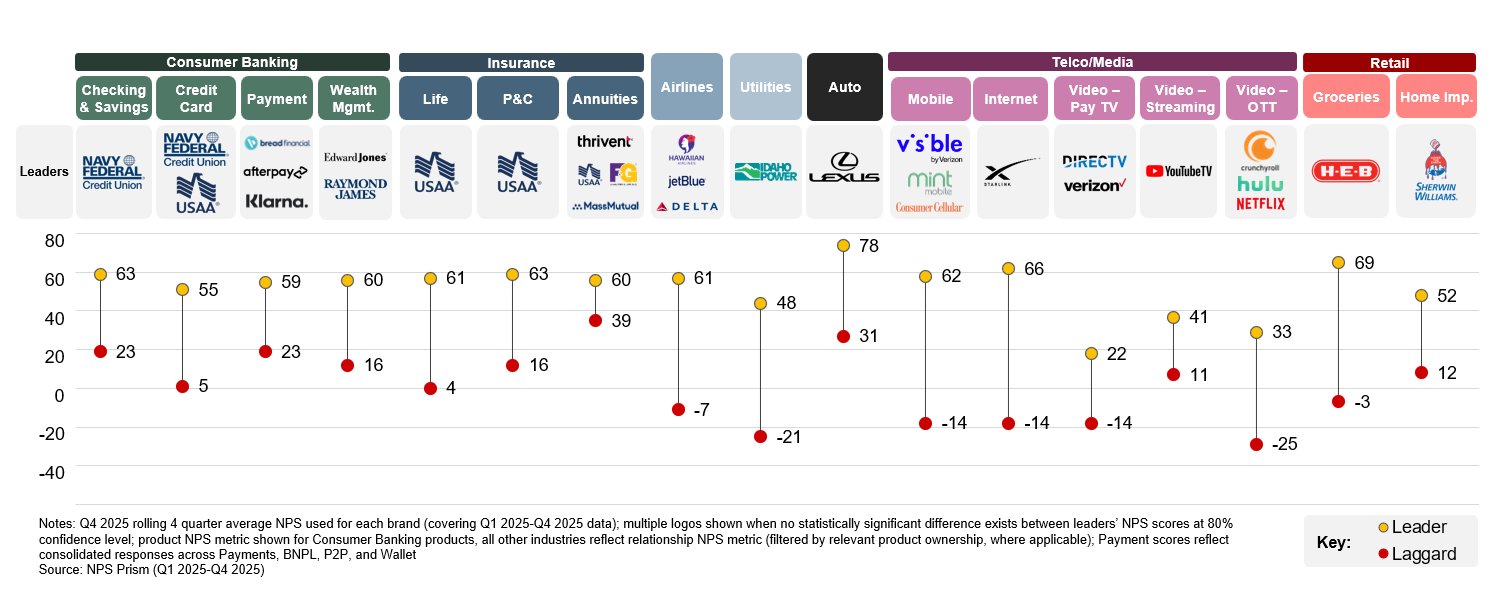
- NPS scores in the Consumer Banking industry range from 5 to 63.
- The auto sector NPS benchmarks range from 31 to 78.
- The NPS scores for the life insurance industry range between 4 and 61.
- For tech industries like mobile telecom, the NPS ranges from -14 to 62.
- The grocery industry NPS ranges from -3 to 69, while for the airlines industry it falls between -7 and 61.
- For internet service providers, the NPS scores fall between -14 and 66.
What to aim for
- For a typical consumer-facing industry, an average NPS of around 30-35 is treated as a baseline healthy score.
- NPS between 40 and 50 is considered a strong score, especially if most peers cluster around 25 to 35.
- 50+ remains the aspirational or world-class threshold.
- For service-heavy or historically low-scoring industries, even an NPS in the 20s or low 30s might signal above-average performance if it outpaces the industry mean.
What is the problem with chasing the industry average NPS scores?
Many brands obsess over a good NPS score in their industry rather than understanding what actually drives customer loyalty for their brand. Here’s why chasing the perfect industry NPS score can sometimes backfire:
1. Teams rely on NPS benchmarks alone
While most teams rely solely on industry NPS benchmarks, they sometimes fail to fully understand the context behind each survey response.
For instance, two companies in the same industry might serve very different customer segments. A fintech app targeting tech-savvy Gen Z users faces higher expectations than a legacy banking service.
So, relying on just the benchmark NPS might not reveal the full picture.
2. NPS is relative inside your business, not outside it
If your industry benchmark is 30, but you’ve stagnated at 35 for years, that’s a problem even if you’re technically performing better than your industry.
That’s because your customers care less about how you perform compared to the industry and more about how you perform compared to their last experience.
3. Difference in the method of gathering NPS
Industry NPS benchmarks are created from broad datasets that smooth out variations between leaders and low performers.
These benchmarks vary due to having different sources, calculation methodologies, sampling frequencies, and customer types. For instance, when determining a benchmark NPS score:
- Some use small, non-representative samples
- Some include only promoters/detractors from specific touchpoints
- Some companies measure relationship NPS, while others measure transaction NPS
Without fully understanding the methodology behind the calculation, comparing your NPS score with the benchmark might not give you relevant, actionable insights.
4. Benchmarks often lead to vanity NPS
Teams often chase industry NPS benchmarks rather than focusing on actions that improve their NPS in the long run. This often leads to:
- Surveying only the happiest customers and ignoring the unhappy customers
- Timing NPS surveys right after positive interactions
- Avoiding friction-reducing improvements because scores might dip
Pro Tip!
Trigger your NPS survey the moment a visitor drops off. Add an open-text follow-up in Wingify User Feedback and let Wingz group the answers by theme and sentiment. This way, you can spot the friction behind a low score without reading every reply.
Go beyond NPS scores with Wingify User Feedback
Even though NPS is an important benchmark, it is not the only metric that defines your growth.
Methods like CSAT and CES also help you gather detailed insights into users’ intent, challenges, and struggles.
With Wingify User Feedback, you can launch surveys at the right moment, triggered by what visitors actually do, and capture contextual feedback across mobile, web, and external channels. You can create a wide range of surveys, such as:
- Web surveys – Triggered by user behavior at key moments, such as when a visitor hesitates, drops off, or converts
- Mobile surveys – Collect in-product feedback from mobile users
- Link surveys – Shared externally via a link
Wingz, Wingify’s AI layer, saves you tons of effort by reading every open-text response, grouping it by theme, and flagging the sentiment behind it.
This helps your team quickly identify patterns in user responses, giving them more time to analyze insights instead of manually reading hundreds of responses.
And because User Feedback is connected to Wingify Experimentation, the “why” behind a score can feed straight into your next test. Spot a recurring theme, turn it into a hypothesis, and measure whether the fix actually improved the experience.
Get in touch now to see how Wingify User Feedback turns NPS responses into your next experiment.
Frequently asked questions (FAQs)
A good net promoter score matters because it reflects customer loyalty, customer satisfaction, and overall growth of the business. High-NPS companies are typically known to enjoy:
– Better word-of-mouth referrals
– Higher lifetime value (LTV)
– Increased revenue efficiency
NPS also functions as an early warning system, detecting friction long before it becomes churn.
Several drivers consistently influence strong NPS performance:
– Response time to customer issues, empathy, and resolution quality
– Timing surveys around key customer interactions to gather valuable customer feedback
– Transparency, reliability, and a positive reputation.
– Friction-free experiences that make it easy for users to find what they’re looking for
Generally, a score below 0 is considered a poor NPS score, as it indicates you have more detractors than promoters.
A score between 0 and 20 is positive, but it leaves room to improve and often sits below the average in many industries. Above 20 is usually seen as a favorable net promoter score.
However, you must always compare your NPS scores with your previous performance and industry baseline to get a better understanding of where you stand.
Yes. NPS can range from –100 to +100, so a negative score is possible, indicating that detractors significantly outnumber promoters. A negative NPS often signals serious issues with product quality, customer experience, service reliability, and brand trust. This often leads to negative word of mouth and poor credibility of the brand.

Hi, there! I’m a Manager, Content Marketing at Wingify with 7+ years of experience in B2B and B2C marketing. I work across blogs, SEO, thought leadership, newsletters, landing pages, and a video podcast I built and manage from scratch. At Wingify, I’ve gained expertise in CRO, experimentation, user behavior research, and personalization, creating content that makes complex ideas clear and actionable. Outside of work, I enjoy experimenting with memes and short-form video on Instagram.