
Most teams don’t lack data. They lack a fast way to go from a number to a decision.
A dashboard shows the drop. Recordings in another tool hint at the cause. Then the fix gets rebuilt from scratch in a testing tool, and half the context is lost along the way.
But, now we have a solution.
We’ve launched Journey Analytics, the quantitative analytics layer built into the Wingify platform. It connects what users do to why they do it, so your team can spot friction, understand it, and act on it using the same platform.

Get started without engineering effort
- One code snippet. Page views, clicks, and form submissions are captured automatically.
- No events to define upfront. No tracking ticket for every new question.
- Data from day one. Build a report later and still look back at earlier data.
- Zero data sampling. Every user counts, tracked on a monthly active user basis.
Find and fix friction with Journey Analytics
Spot changes early with metric reports:
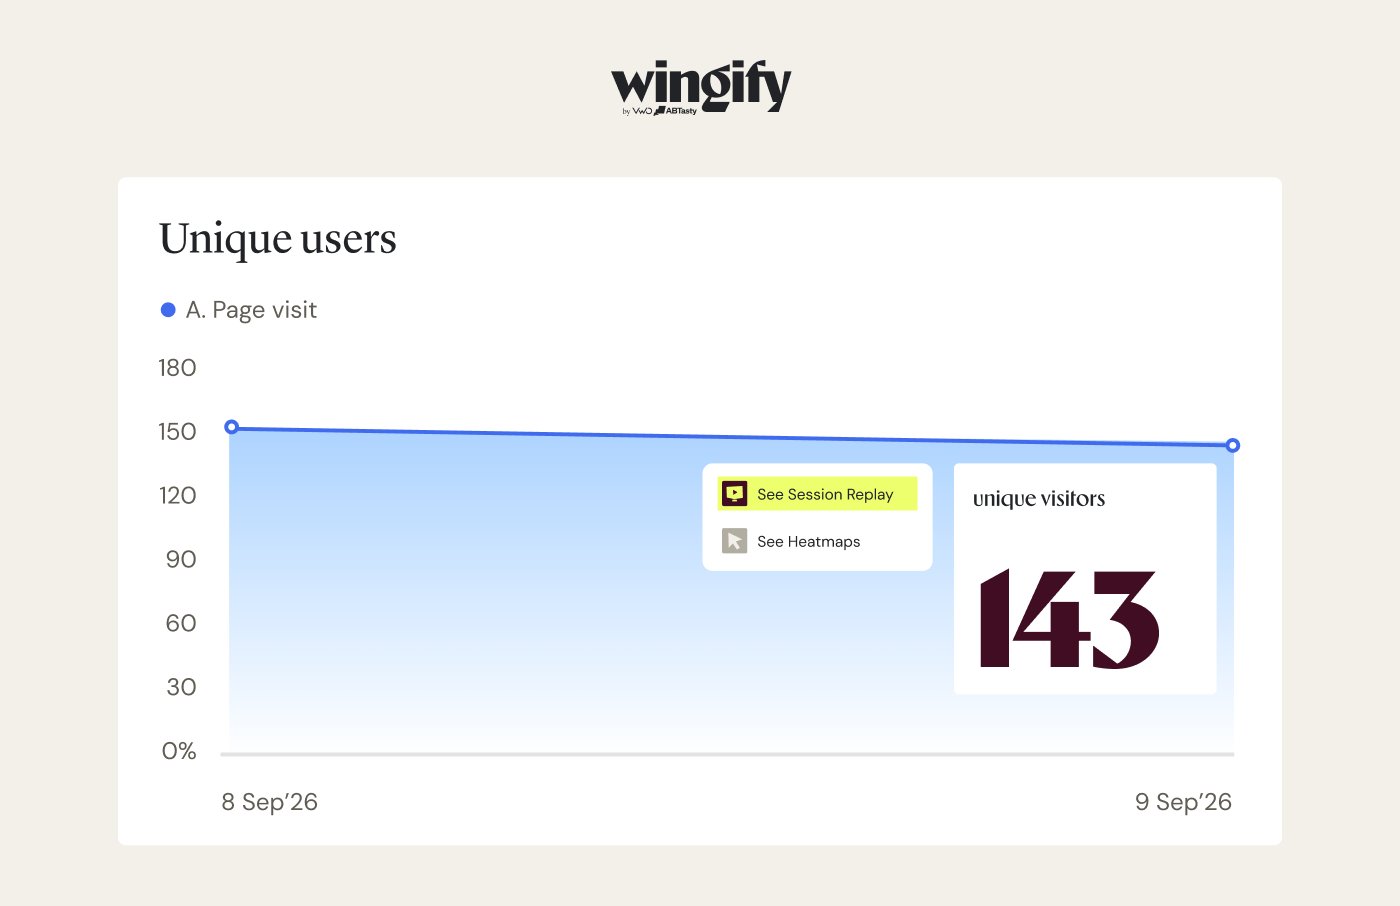
Metric reports track events, unique users, and frequency over time, so you notice when a number starts heading the wrong way. You can also factor in seasonality when you compare periods.
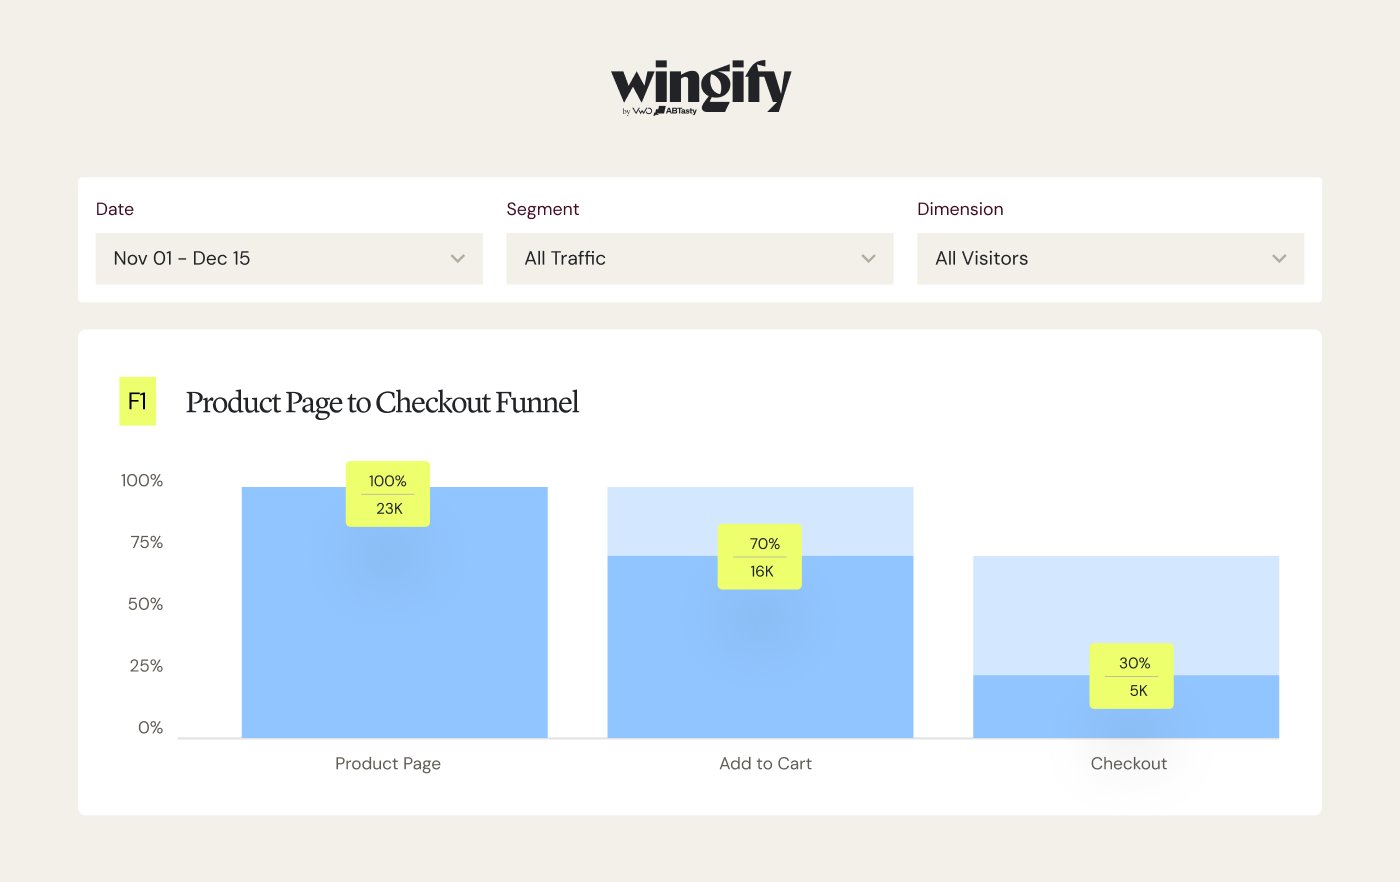
See where people drop off using funnels:
Funnel reports map a conversion path step by step and show which step loses users.
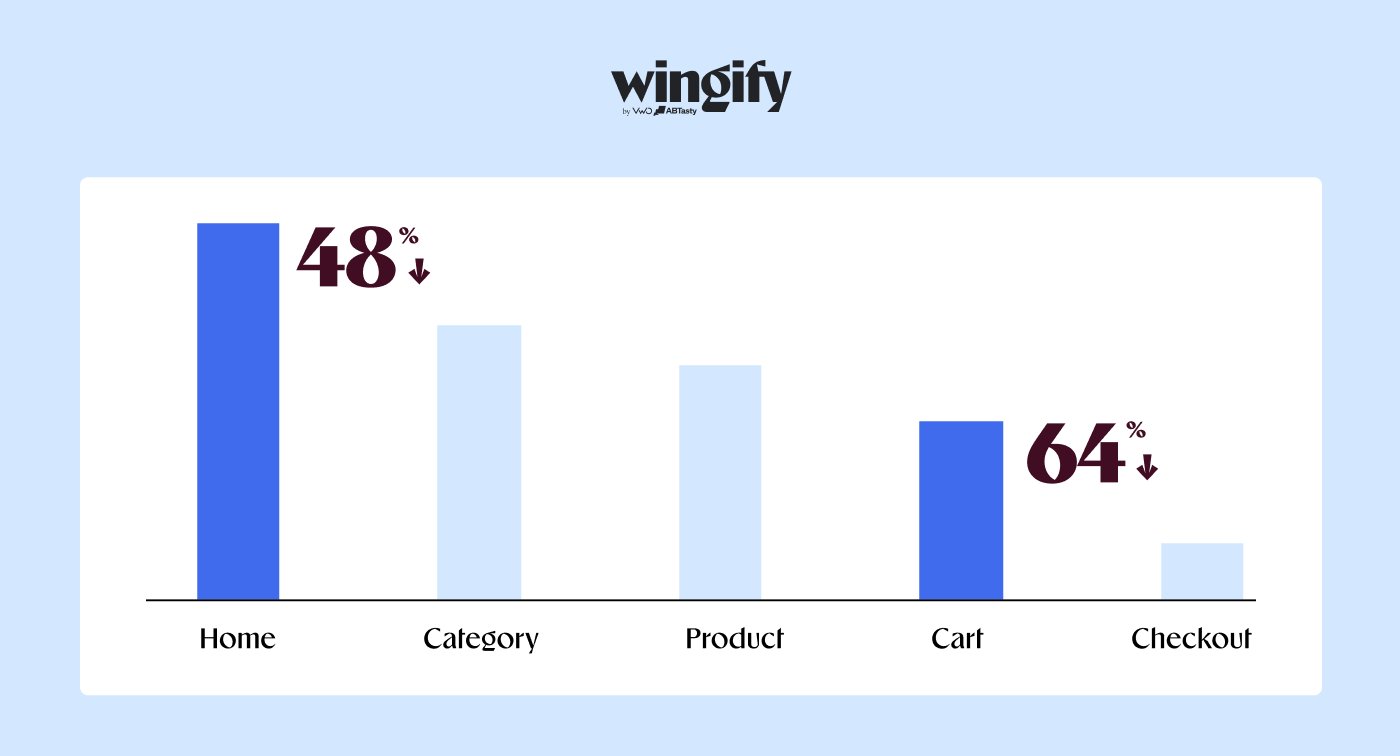
Follow the paths users take with user flows:
User flows show the routes people take before or after a key event, including the ones you didn’t anticipate.
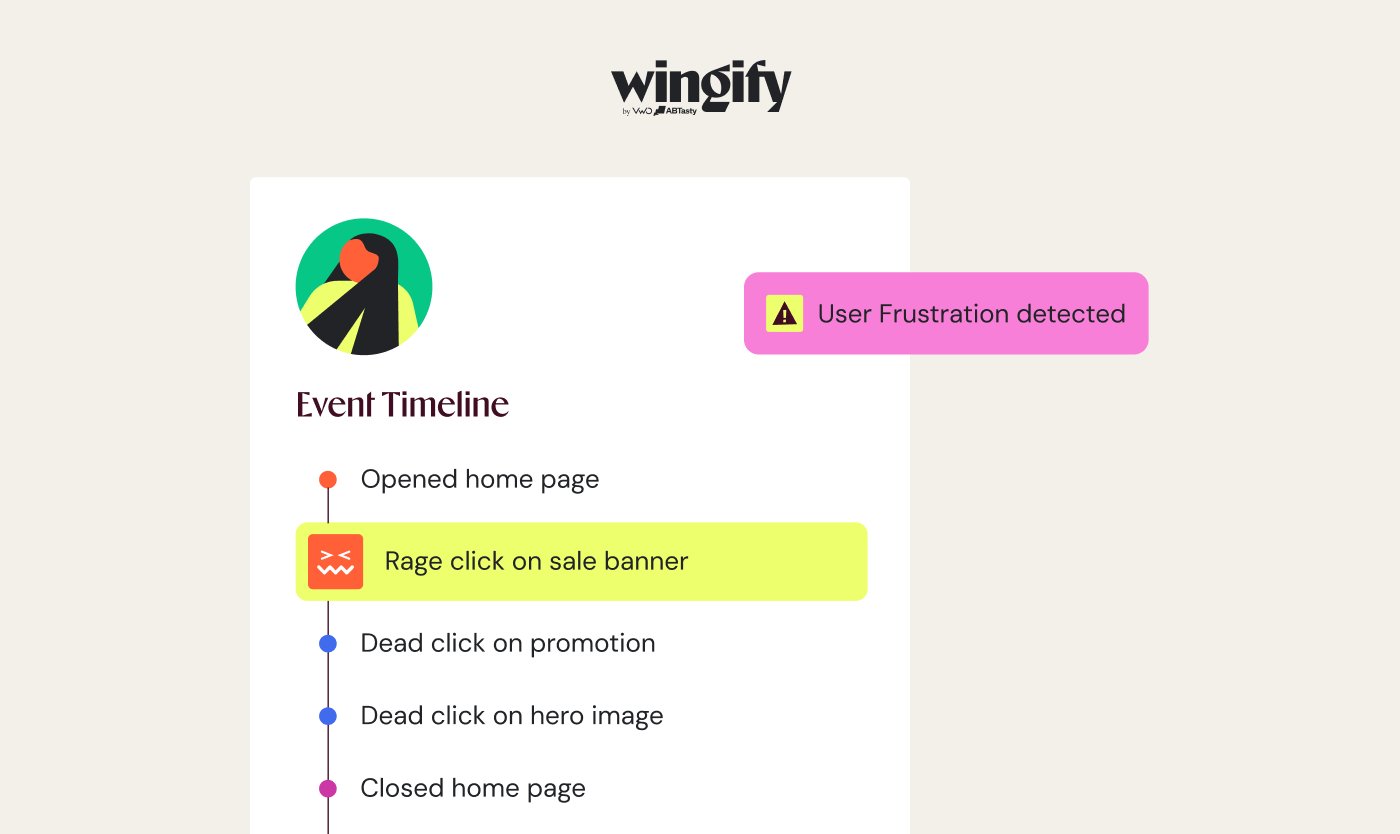
Keep the team on the same page:
Boards bring your key metrics, funnels, and journeys into one shared view you can track over time.
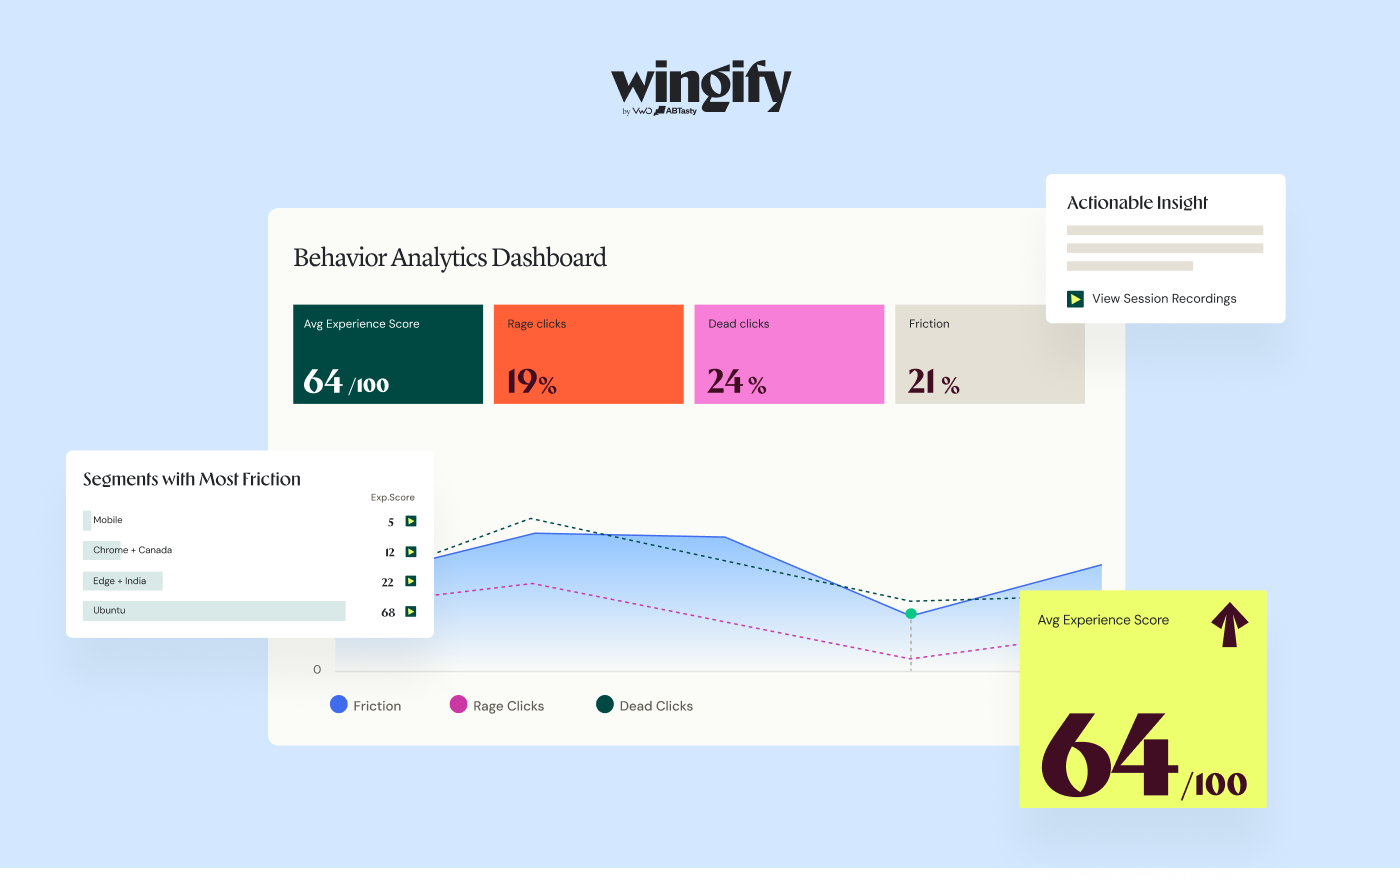
Watch the behavior behind the number:
From any report, open the matching session recordings or heatmaps in one click.
Get answers faster with Wingz:
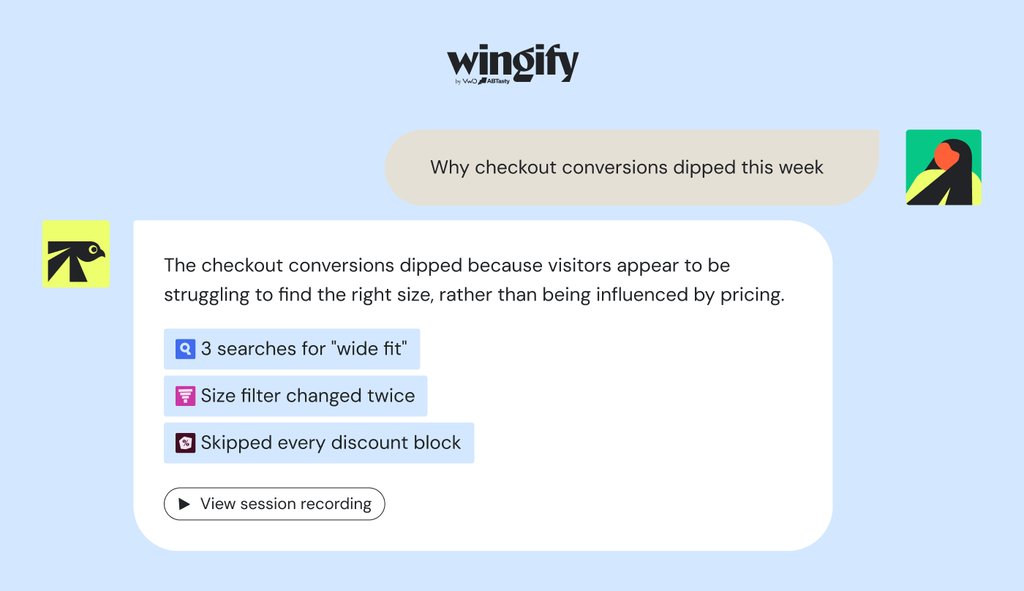
Wingify’s agentic AI layer reads your quantitative and behavioral data together. Ask Wingz why checkout conversions dipped this week, and it pulls the recordings tied to the dip, reviews them, and suggests what to do next.
Do more with the Wingify Analytics Suite
Start with one and add the others as you grow. Already have an analytics stack?
Journey Analytics works alongside it. Since it all runs on one platform, every finding can go straight into an A/B test or a personalized experience.
- Journey Analytics shows what users do.
- Behavior Analytics shows how they do it, with heatmaps, session recordings, and funnel analysis.
- User Feedback captures why, straight from users in the moment.
Conclusion
By putting the numbers, the behavior behind them, and the next test in one place, Journey Analytics helps your team move from question to fix with less back and forth.
- Answer new questions without waiting on engineering
- Make decisions on complete data with zero data sampling
- Go from insight to test on one platform
Get started with Journey Analytics to find where users drop off and why. Book a demo today!
Categories:

Pritika Ramani is Director of Product Marketing at Wingify, and specializes in product positioning, go-to-market strategy, and customer-centric storytelling, helping bring innovative SaaS products to market. She has 12+ years of experience in the B2B SaaS space and has worked in companies such as Zoho, Freshworks and Yellow.ai.