
We had launched clickmaps and heatmaps for A/B tests recently in VWO. Since then it has become the most popular feature amongst our users. We aren’t surprised by the success of this new feature because it gives a new angle to A/B test results. While you can always get information about conversion rate, bounce rate, and other hard metrics from standard reports, visualizing “hotspots” on a page has a charm of its own.
Download Free: Website Heatmap Guide
Based on feedback from a user, we rolled out a new minor feature: consolidated clickmaps. Unlike traditional clickmaps, which show results only for a particular page, this new feature will aggregate click activity on ALL your website pages to show which parts get the most clicks. This is useful if you have a website that has a common template/theme across different pages (e.g. header, footer, sidebar, product box, etc.). Using consolidated clickmaps, you will be able to see statistics for elements common to your website.
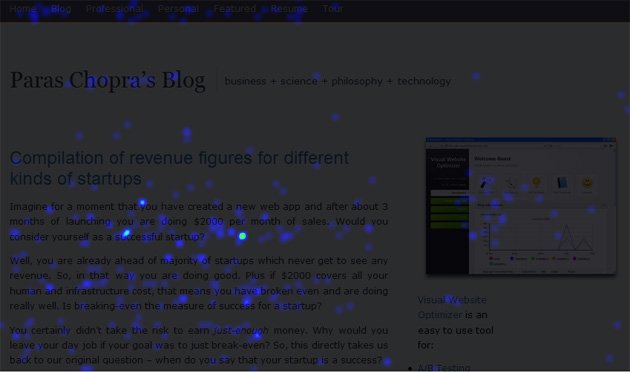
This feature came in handy when I analyzed visitor activity on my blog. All I had to do was to enter a URL pattern (*//https://www.paraschopra.com/blog\\*) which instructed Wingify to generate a consolidated heatmap for all blog posts (technical detail: Wingify combined heatmap data for all pages matching the URL pattern; * matches anything and that’s why the entered URL pattern matched all blog posts).
Here is the consolidated heatmap for all my blog posts:
Contrast this with a heatmap only for a single post:
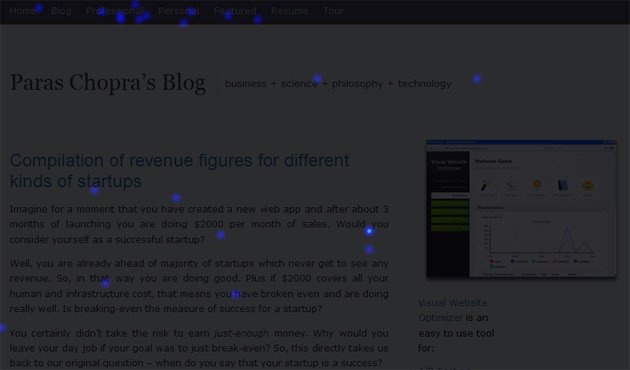
As you can see, the consolidated heatmap has much more information than a single blog post heatmap. That is the real utility; you get to observe patterns of visitor behavior across your website which you may have otherwise missed or would require you to browse through tens of different heatmaps and then stitch patterns in your head.
Using this feature, you also get to see consolidated clickmaps. Here is a screenshot:
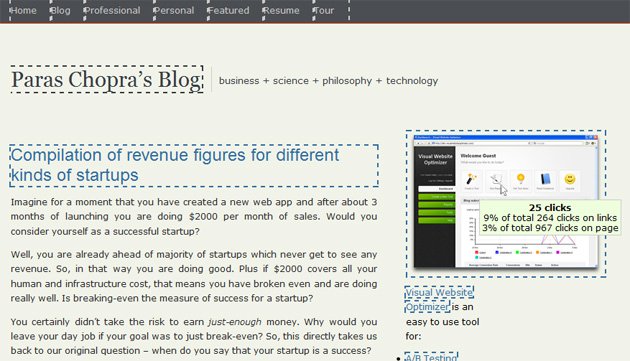
The consolidated clickmap clearly shows that 10% of all clicks on the page occur on the Wingify banner on my blog. Some more statistics from the clickmap:
- Only 5% of all clicks are made to navigate to the main blog from a specific blog post (that is why blogs have high bounce rates; visitors are rarely interested in other content on the blog)
- Only 1% of all clicks are made on RSS subscribe links
- From Wingify test reports (not shown):
- 80% of visitors leave the website without making any click
- Only 0.2% of visitors subscribe to blog updates
- 1.5% of visitors click on the large Wingify banner in the sidebar
The stats are a bit on the lower side but if you observe the consolidated heatmap, you will see a lot of click activity on post text. This means that even though visitors aren’t clicking on links, they are still interacting with the post and reading it!
Download Free: Website Heatmap Guide
I hope you like the new feature! If you’d like to give it a spin simply login to your account (it is enabled by default for all accounts). Or, if you aren’t an existing user, signup for a free trial here.
Watch the video to get an overview of Wingify Heatmaps:
PS: Technical details. If you are wondering how we can generate a consolidated heatmap, here is the trick: we don’t store absolute X and Y positions of visitor clicks. Rather we store xpath of the element being clicked. Common elements on the website have the same xpath across different pages, hence we are easily able to aggregate that data.
Categories:

I started Wingify in early 2009 to enable businesses to design and deploy great customer experiences for their websites and apps. I have a background in machine learning and am a gold medalist from Delhi College of Engineering. I have been featured twice in the Forbes 30 under 30 list - India and Asia. I'm an entrepreneur by profession and my curiosity is wide-ranging. Follow me at @paraschopra on Twitter. You can email me at paras@wingify.com