Click maps
See where visitors click
Discover which buttons, links, images, and other elements attract clicks. Identify overlooked calls to action, unexpected interactions, and distractions that take visitors away from what matters.
Wingify Behavior Analytics > Heatmaps
Understand how visitors interact with your website, from the elements they click to the content they scroll past. Spot friction, uncover missed opportunities, and find out where your experience could work harder.
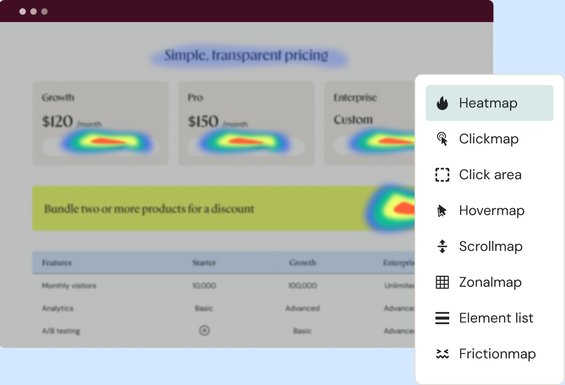
























Heatmaps turn visitor behavior into a visual view of how people interact with your pages. See which elements attract attention, which go unnoticed, and where the experience may be falling short.
Click maps
Discover which buttons, links, images, and other elements attract clicks. Identify overlooked calls to action, unexpected interactions, and distractions that take visitors away from what matters.
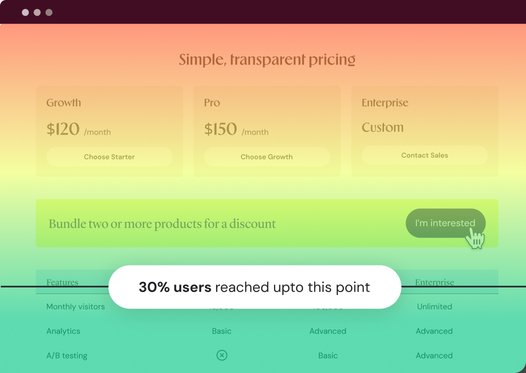
Scroll maps
See how much of your page visitors actually view. Find out whether important messages, product details, forms, and calls to action appear where people are likely to see them.
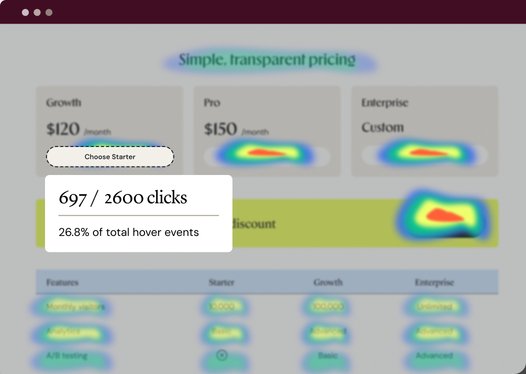
Hover maps
Explore hover behavior to see which page elements draw visitor attention. Compare hover activity with clicks to investigate elements that engage visitors but don’t prompt action.
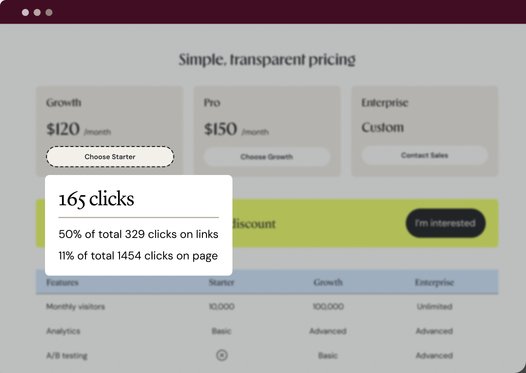
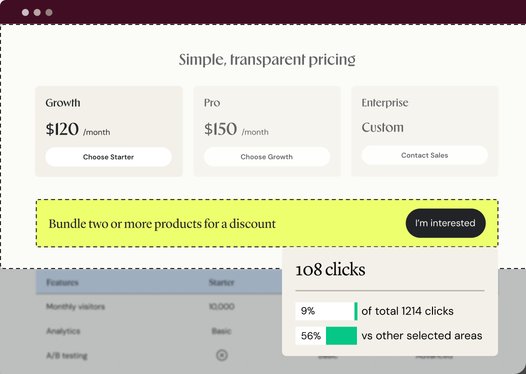
Click-area analysis
Compare clicks across selected areas of a page to understand which sections receive more engagement. Use these insights to evaluate content placement, layout, and calls to action.
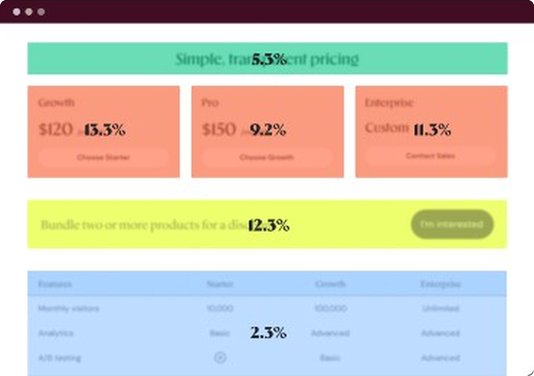
Zonal maps
Divide a page into zones and compare engagement, click rates, and conversion-related metrics where available. Identify sections that perform well and areas that may need a different approach.
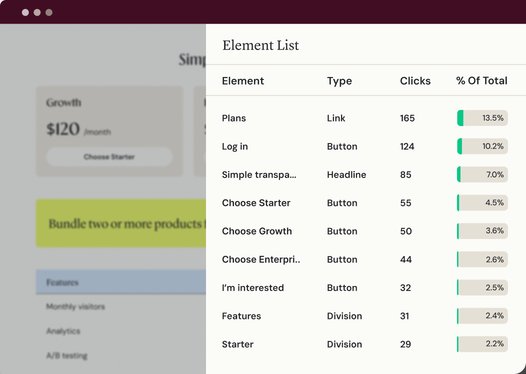
Element-level click data
Explore click data for specific page elements, including elements that may not be immediately visible. Investigate unexpected interactions and understand how visitors engage with individual components.
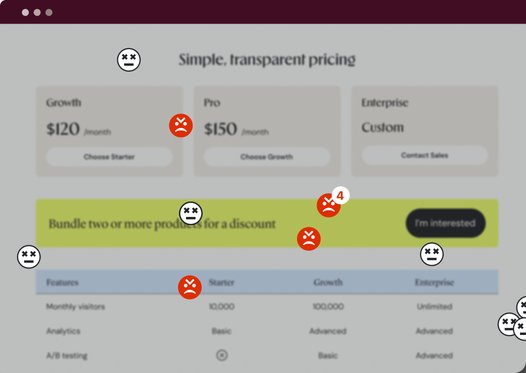
Friction maps
Identify rage clicks, dead clicks, and error clicks that can signal unresponsive elements, broken links, or confusing interface patterns. Pinpoint potential usability issues that conventional analytics may not explain on their own.
Compare engagement patterns, explore differences between audiences, and identify opportunities to improve the experience.
Filter your analysis to investigate specific page areas and interaction patterns. Narrow your view to the clicks, scrolling behavior, and friction signals most relevant to the question you’re trying to answer.
Inspect interactions on pages with modals, banners, dropdowns, and dynamic content. Understand how visitors engage with elements beyond a static page layout.
Review heatmaps for different versions of a page to understand how behavior changes after a redesign or content update. Investigate whether changes are helping visitors find and use what matters.
Compare heat maps across experimentation variations to see how visitors interact with different designs, layouts, and calls to action. Investigate which elements may be influencing behavior alongside your experiment results.
Compare interactions across new and returning visitors, desktop and mobile users, browsers, geographic segments, traffic sources, and other available visitor attributes. Understand how different audiences experience the same page.
Use click patterns, scroll behavior, and friction signals to identify potential improvements to content placement, page structure, calls to action, and other elements. Turn observations into hypotheses you can evaluate through experimentation.
AI as your clarity
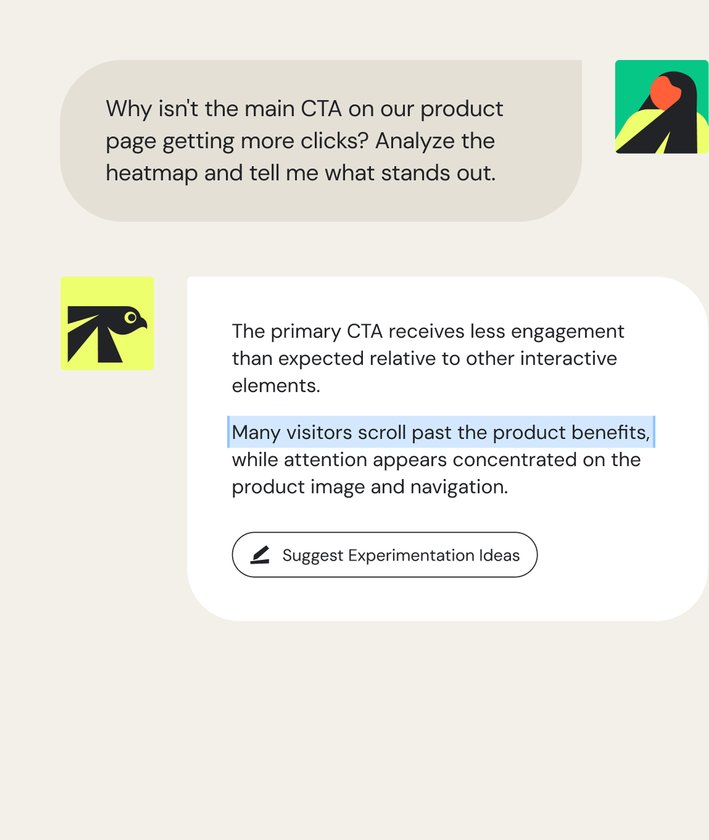
Wingz scans your heatmaps for you, highlighting high- and low-interaction areas and conversion bottlenecks. It flags cold zones, rage clicks, and dead clicks, so you don’t have to hunt for them.
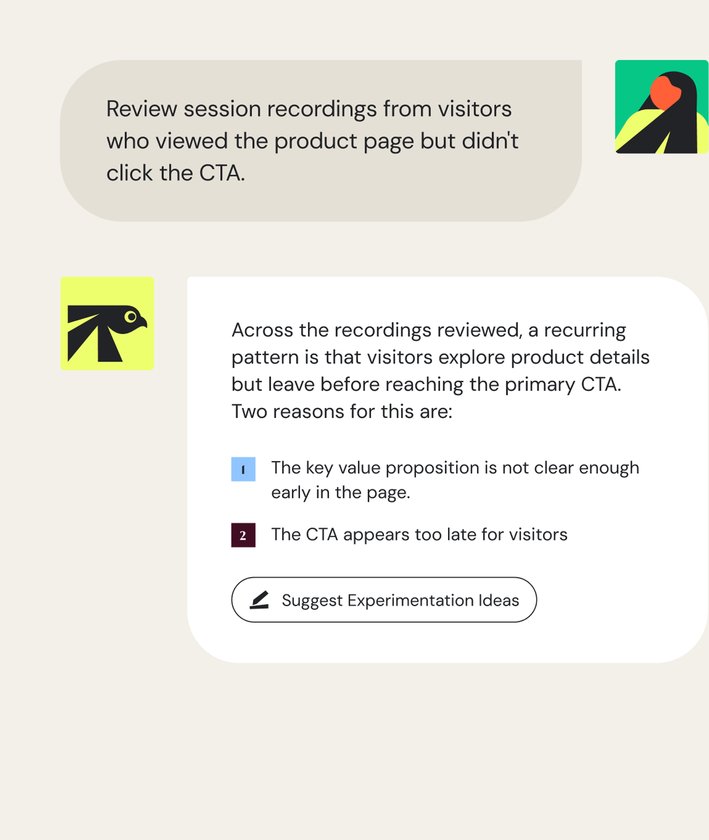
Wingz combines heatmap data with session recordings to recommend layout fixes and A/B test ideas.
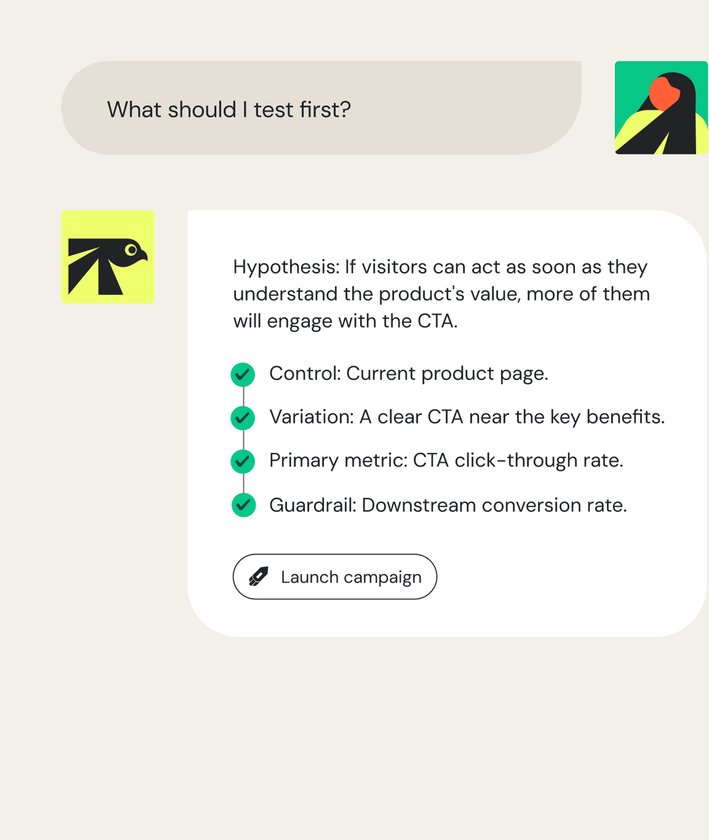
Wingz builds the variation, and your team can launch it.
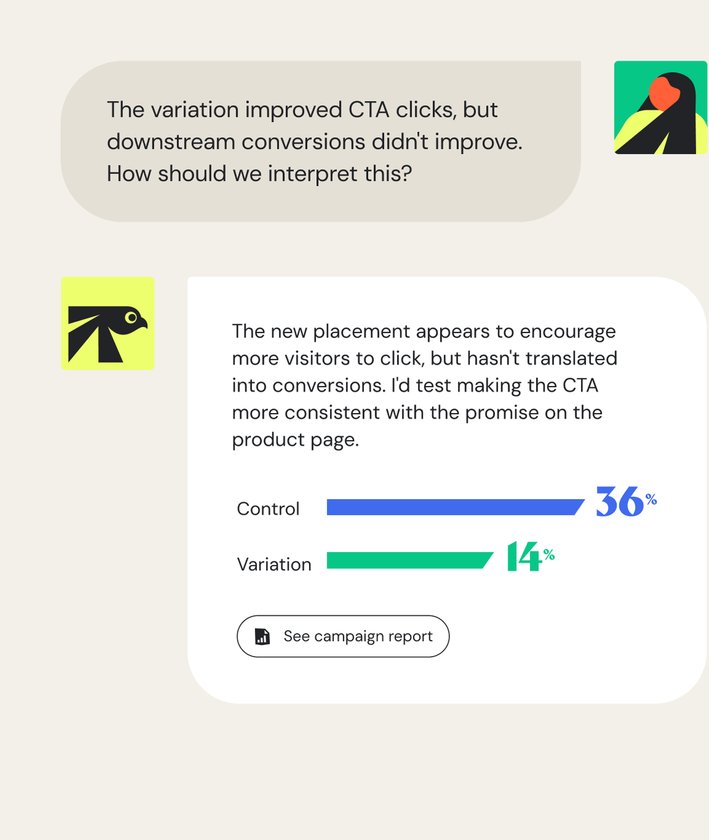
Wingz measures results from the new experiment you run, so you can carry the learnings into the next stage.
Wingify meets the highest security and data privacy standards across the globe, with 24/7 priority support.
We carry industry-leading certifications. Your data stays protected while helping you meet global and regional regulatory requirements with confidence.


Data centers in the US, the EU, and India.
A dedicated success manager and technical experts, with 24/7 support and a consistent CSAT of 99%.


Free for 30 days. No credit card required.
Talk to a sales representative
Your dedicated Wingify representative will be in touch shortly to set up a time.
at

Increase in Trial activation