
I work as a web analytics consultant, helping companies and other organizations use data to improve their websites. Last year, I worked on a project with a large non-profit that was using Wingify to A/B test different flows through their donation funnel. The old flow hadn’t been updated in years, so they were interested in testing different page layouts and optimizing for mobile.
This is the story of how those A/B tests motivated me to build a universal API Connector for Google Sheets, which now has over 20,000 users and handles about 10,000 API requests a day directly from Google Sheets.
Download Free: A/B Testing Guide
A Dashboard for Wingify
Many eyes were on this project, so the client requested a summary dashboard for the duration of the A/B tests (which continued throughout the year). The dashboard would contain some data visualizations, predicted metrics, and a summary table like this:
| CONTROL | VARIATION | TOTALS | |
| Visitors | 1000 | 1000 | 2000 |
| Conversion Rate | 1.50% | 1.40% | 1.45% |
| $/Donation | $50 | $55 | $52 |
| $/Visitor | $0.75 | $0.77 | $0.76 |
All the data above is already available in Wingify, but we decided to make the dashboard in Google Data Studio instead, for a few reasons:
- We wanted to customize the dashboard to highlight these key metrics at a glance
- Not everyone in the organization had access to Wingify
- We were running some supporting analysis outside Wingify, e.g. a histogram of donation sizes, and wanted to include that in the dashboard as well.
Moving Data Around
How do you move data from one platform to another, in this case Wingify to Google Data Studio? This is a common business need, with many different approaches. On one end of the spectrum, people may simply export to CSV or email their files directly from the interface of the tool they’re using. On the other end, companies build sophisticated data warehouses that load and integrate data from all their data sources, and then run business intelligence tools on top for querying and visualizing the data.
Somewhere in the middle, there are tools like Google Sheets. Google Sheets provides a scripting language, based on JavaScript, which has enabled a thriving ecosystem of add-ons in the G Suite Marketplace. Many add-ons connect Sheets to popular platforms like Facebook and Google Analytics (Supermetrics is the most popular add-on of this type, with integrations for about 50 different platforms.) This lets people pull in data with the click of a button, enabling some level of automation while avoiding the cost and complexity of a full data warehouse.
Google Sheets would be a great solution here, especially since it plugs directly into Google Data Studio. However, in this case, there was no existing add-on or integration for VWO. In fact, there were thousands and thousands of platforms without any integration. One thing nearly all these platforms had in common, though, was that they provided access to their data via an API. I checked out the documentation for Wingify’s REST API, which showed I could hook into it with a script to pull data from Wingify into Sheets. But why stop there? I wanted a universal API connector, that would connect any API into Sheets, without requiring a pre-built integration or a custom script each time.
And, fast-forwarding through several months of development, API Connector was born ? It imports data from any API into Google Sheets, using just a request URL and API key, no code required.
Download Free: A/B Testing Guide
Using API Connector With Wingify
In this section, I’ll outline how to use API Connector to pull data from the Wingify API directly into Google Sheets.
- Install the API Connector add-on to Google Sheets (Go to: https://mixedanalytics.com/api-connector/).
- To access the Wingify API, you need an API token, which is similar to a password. To generate your token, navigate to https://app.wingify.com/#/developers/tokens.
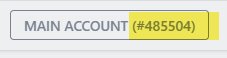
- You’ll also need your account ID. Your account ID is available at the top of your Wingify dashboard:
4. If you’re looking for details on a specific campaign, you’ll need to know the ID of that campaign. You can find your campaign number by clicking into the campaign while logged into your dashboard, and checking the URL:

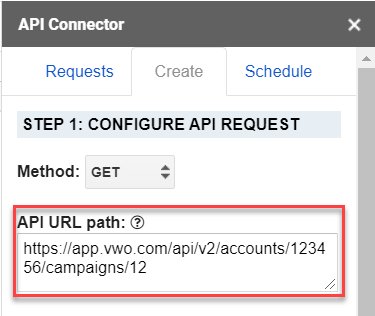
5. The API request URL for campaign metrics takes on the following format: “https://app.wingify.com/api/v2/accounts/{account_id}/campaigns/{campaign_id}”
Enter that URL into the API URL path field in API Connector, like this:
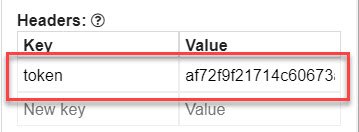
6. In the Headers section, enter the word token for your Key, and your API token for the Value, like this:
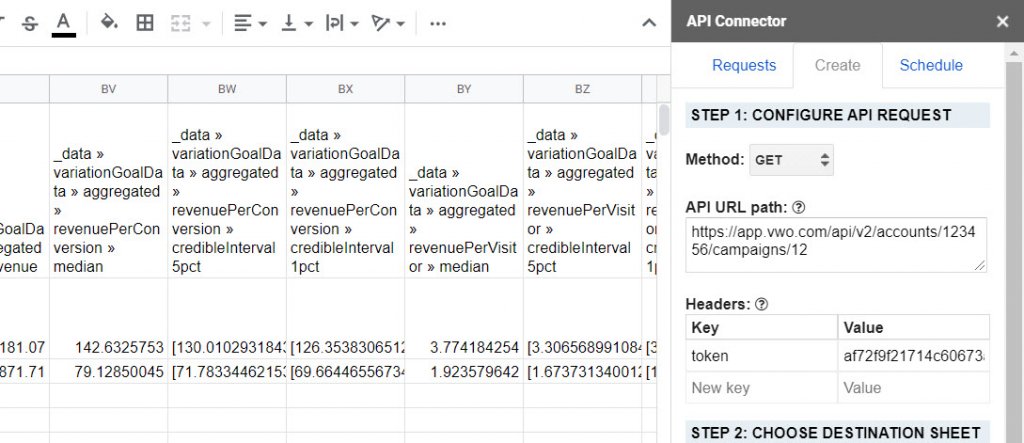
7. Click Run and you’ll see your Wingify test data populate your Sheet.
8. Now, go forth and explore the API! Every data point from Wingify is available via the API, so you can create and automate dashboards using any platform metric. Check the API documentation for the full list of available endpoints.
Fun fact: as I was the first user, Wingify was the very first API ever used with API Connector. I used the first version of API Connector to connect to Wingify’s API and pull in fresh data hourly. I then connected the Sheet to Data Studio to complete the A/B testing dashboard for the donation flow test. I now use this basic setup daily to generate custom, automated reports and dashboards for my clients.
Categories:

Ana Kravitz is the founder of Mixed Analytics, which provides analytics consulting and extensions for Google Sheets. After receiving an MBA from New York University, she worked as a web analyst for several years before striking out on her own. Her experience working with clients led her to develop the API Connector extension for Google Sheets, which is now the primary focus of Mixed Analytics. She is based in Taiwan.