Free Tool
A/B Test Statistical Significance
Calculator
Want to run an online A/B test? Calculate its significance with our Bayesian-powered calculator built for experimentation, CRO, and UX Optimization.
P-Value
(Range from 0-1)0.334
Significance
No
Peek inside Wingify's testing brain
Get a DemoSee how to automate significance & run tests you can trust
Explore advanced statistical parameters such as ROPE, MDR, FPR
Dive deeper into Sequential Testing, Bonferroni Correction, Fixed Horizon Test
What is statistical significance?
Statistical significance quantifies whether a result obtained is likely due to chance or some factor of interest. You can utilize a significance calculator to confidently evaluate and interpret your results. The data-driven approach empowers you to make informed decisions for optimization and ultimately achieve your desired outcomes.
Different approaches to calculate statistical
significance
The two commonly used approaches are Frequentist and Bayesian, which power different test statistics calculators. Here is a brief information on each.
Frequentist
Frequentist statistics involves examining the frequency of events. It looks at how often something happens in a given situation.
Bayesian
Bayesian statistics is all about changing your opinion. It starts with an initial belief called the prior, which comes from domain expertise. Then, you gather evidence to support or challenge that belief. After examining the evidence, your opinion should be updated based on the new information you’ve acquired.
How do we calculate statistical significance?
Here is how you can calculate statistical significance using the Frequentist and Bayesian approaches.
Frequentist approach
The Frequentist approach to statistical significance is based on the p-value. To determine the p-value using the Frequentist approach, you will need the following key pieces of information:
- The mean difference between the two hypotheses
- The standard deviation of the difference between the two hypotheses
- The sample size of each hypothesis
Once you have gathered this necessary data, you can easily compute the p-value using a significance testing tool or significance level calculator. If the p-value you get is 0.05, the probability of the variation is 5%.
Bayesian Approach
In this, you do statistical significance calculation through posterior probability. The posterior probability considers the available data and represents the probability of hypothesis A or B being true. The approach takes into account both prior beliefs and the evidence observed in the data.
To calculate the posterior probability, Bayes' theorem is employed. Bayes' theorem is a mathematical formula that combines the prior probability of a hypothesis with the likelihood of the data to derive the updated or posterior probability.
A posterior probability of greater than 95% is considered to be strong evidence in favor of the hypothesis.
Know more about our Bayesian approach in the article series we created on Bayesian A/B testing at Wingify.
Why do we use Bayesian statistics?
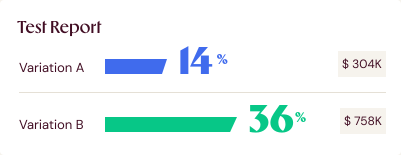
Intuitive Test Reports
At Wingify, we recognize that non-statistical users often misinterpret the frequentist p-value as a Bayesian posterior probability, which leads to incorrect conclusions about the superiority of one variation over another. To address this issue, we developed the industry's first Bayesian statistical engine.
Our Bayesian statistical engine provides users with easily understandable results, eliminating the risk of making mistakes while conducting A/B tests on revenue or other crucial key performance indicators (KPIs). By adopting a more intuitive approach, we ensure that our users obtain accurate insights from our A/B test statistical significance calculator.
With our solution, you can have confidence in the statistical significance of your results, making informed decisions to optimize your testing, revenue generation, and overall user experience. Say goodbye to misinterpretations and embrace the power of the Bayesian A/B test calculator for reliable and actionable A/B testing outcomes.
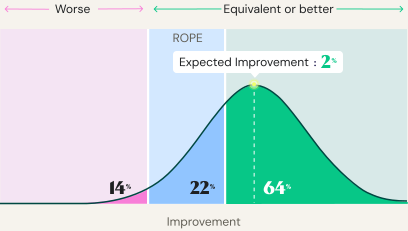
Get clear comparisons against the baseline
Identify if variations outperform, match, or fall below the baseline with our advanced stats engine. Results are declared at a 95% probability threshold. Detailed graphs offer clear insights for effective decision-making.
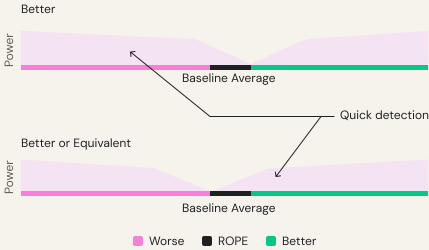
Actionable Results, Faster
Wingify offers two testing objectives, "Better" and "Better or Equivalent," both built on ROPE (Region of Practical Equivalence), which offers asymmetric power in tests.
The "Better" objective helps you quickly identify underperforming variations. This speeds up your evaluations and lets you focus on implementing successful changes faster.
The "Better or Equivalent" objective delivers quicker experiment results when you're looking for either an improvement over the baseline or a performance that's essentially the same.
Show your shoppers what they came for.

Frequently Asked Questions
Here is what teams usually ask before they start
The null hypothesis states that there is no difference between the control and the variation. This essentially means that the conversion rate of the variation will be similar to the conversion rate of the control.
The p-value is defined as the probability of getting results at least as extreme as the ones you observed, given that the null hypothesis is correct, where the null hypothesis in A/B testing is that the variant and the control are the same.
Statistical significance quantifies whether a result obtained is likely due to a chance or some to some factor of interest. When a finding is significant, it essentially means you can feel confident that a difference is real, not that you just got lucky (or unlucky) in choosing the sample.
Statistical power is the probability of finding an effect when the effect is real. So a statistical power of 80% means that out of 100 tests where variations are different, 20 tests will conclude that variations are the same and no effect exists.